PROTECTED SOURCE SCRIPT
VIX (StevenCharts)
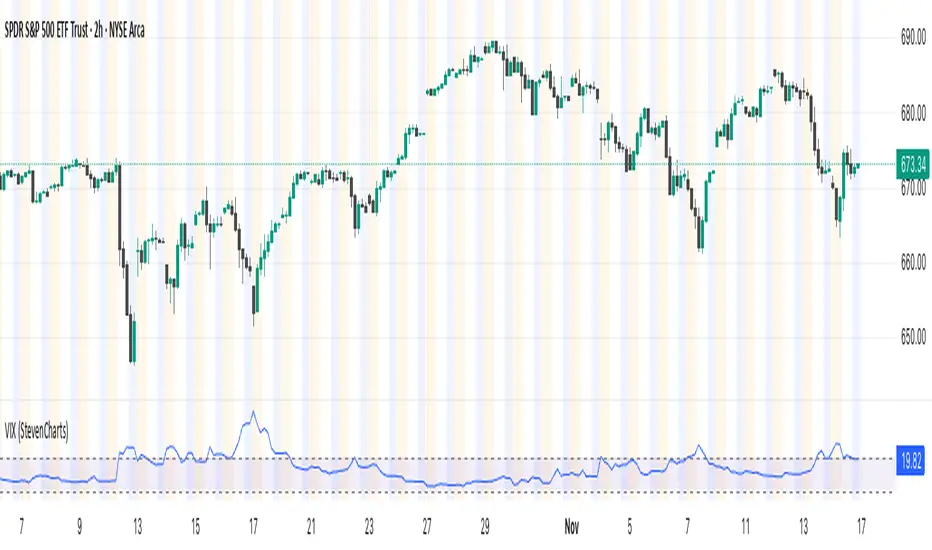
This indicator plots the VIX (CBOE Volatility Index) in a separate pane to help you quickly gauge market sentiment and volatility.
It highlights the key zone between 15 and 20, which often acts as a transition area between low and high-volatility regimes.
Features:
Plots the VIX line.
Allows you to change the color of the VIX line.
It highlights the key zone between 15 and 20, which often acts as a transition area between low and high-volatility regimes.
Features:
Plots the VIX line.
Allows you to change the color of the VIX line.
نص برمجي محمي
تم نشر هذا النص البرمجي كمصدر مغلق. ومع ذلك، يمكنك استخدامه بحرية ودون أي قيود - تعرف على المزيد هنا.
إخلاء المسؤولية
لا يُقصد بالمعلومات والمنشورات أن تكون، أو تشكل، أي نصيحة مالية أو استثمارية أو تجارية أو أنواع أخرى من النصائح أو التوصيات المقدمة أو المعتمدة من TradingView. اقرأ المزيد في شروط الاستخدام.