OPEN-SOURCE SCRIPT
تم تحديثه MarketTrend [AlchimistOfCrypto]
🌌 MarketTrend [AlchimistOfCrypto] – Unveil the Cosmic Harmony of Markets 🌌
"What we call 'trend' is merely an illusion of our limited perception of the space-time continuum of markets. Pivots are points of singularity where potential energy ⚡️ transforms into kinetic energy 🚀. The fourth dimension isn’t just time—it’s the simultaneous awareness of all temporal states. By observing mathematical laws across time scales, we unlock the secrets of the cosmic harmony of markets."
📊 Technical Overview
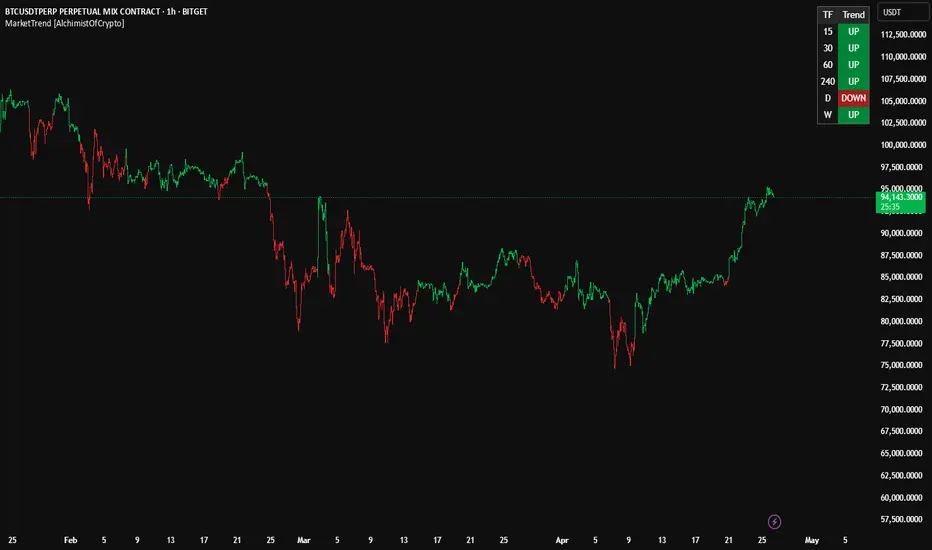
MarketTrend is a multi-timeframe trend analysis powerhouse 🔥 that tracks market direction across six timeframes simultaneously. It pinpoints pivot points 📍 to classify trends as bullish 🐂, bearish 🐻, or neutral ⚖️, presenting results in a sleek, easy-to-read table.
⚙️ How It Works
- The algorithm scans for pivot highs and pivot lows using a 20-bar lookback period 🔍.
- Bullish Trend 🟢: Price breaks above a previous pivot high.
- Bearish Trend 🔴: Price drops below a previous pivot low.
- Neutral Zone 🟡: Price consolidates until a breakout sparks a new trend.
🚀 How to Use This Indicator
1. Master Multi-Timeframe Analysis 🌍: Spot trend alignment across timeframes for a holistic view.
2. Seek Confluence ✅: Stronger signals emerge when multiple timeframes align.
3. Time Your Entries ⏰: Enter trades when shorter timeframes sync with larger ones for maximum precision.
4. Manage Risk 🛡️: Avoid countertrend trades when timeframes show unified direction.
"What we call 'trend' is merely an illusion of our limited perception of the space-time continuum of markets. Pivots are points of singularity where potential energy ⚡️ transforms into kinetic energy 🚀. The fourth dimension isn’t just time—it’s the simultaneous awareness of all temporal states. By observing mathematical laws across time scales, we unlock the secrets of the cosmic harmony of markets."
📊 Technical Overview
MarketTrend is a multi-timeframe trend analysis powerhouse 🔥 that tracks market direction across six timeframes simultaneously. It pinpoints pivot points 📍 to classify trends as bullish 🐂, bearish 🐻, or neutral ⚖️, presenting results in a sleek, easy-to-read table.
⚙️ How It Works
- The algorithm scans for pivot highs and pivot lows using a 20-bar lookback period 🔍.
- Bullish Trend 🟢: Price breaks above a previous pivot high.
- Bearish Trend 🔴: Price drops below a previous pivot low.
- Neutral Zone 🟡: Price consolidates until a breakout sparks a new trend.
🚀 How to Use This Indicator
1. Master Multi-Timeframe Analysis 🌍: Spot trend alignment across timeframes for a holistic view.
2. Seek Confluence ✅: Stronger signals emerge when multiple timeframes align.
3. Time Your Entries ⏰: Enter trades when shorter timeframes sync with larger ones for maximum precision.
4. Manage Risk 🛡️: Avoid countertrend trades when timeframes show unified direction.
ملاحظات الأخبار
Add the candle Colorملاحظات الأخبار
Wick on candleنص برمجي مفتوح المصدر
بروح TradingView الحقيقية، قام مبتكر هذا النص البرمجي بجعله مفتوح المصدر، بحيث يمكن للمتداولين مراجعة وظائفه والتحقق منها. شكرا للمؤلف! بينما يمكنك استخدامه مجانًا، تذكر أن إعادة نشر الكود يخضع لقواعد الموقع الخاصة بنا.
My Website for the traders !
إخلاء المسؤولية
لا يُقصد بالمعلومات والمنشورات أن تكون، أو تشكل، أي نصيحة مالية أو استثمارية أو تجارية أو أنواع أخرى من النصائح أو التوصيات المقدمة أو المعتمدة من TradingView. اقرأ المزيد في شروط الاستخدام.
نص برمجي مفتوح المصدر
بروح TradingView الحقيقية، قام مبتكر هذا النص البرمجي بجعله مفتوح المصدر، بحيث يمكن للمتداولين مراجعة وظائفه والتحقق منها. شكرا للمؤلف! بينما يمكنك استخدامه مجانًا، تذكر أن إعادة نشر الكود يخضع لقواعد الموقع الخاصة بنا.
My Website for the traders !
إخلاء المسؤولية
لا يُقصد بالمعلومات والمنشورات أن تكون، أو تشكل، أي نصيحة مالية أو استثمارية أو تجارية أو أنواع أخرى من النصائح أو التوصيات المقدمة أو المعتمدة من TradingView. اقرأ المزيد في شروط الاستخدام.