OPEN-SOURCE SCRIPT
Multi TimeFrame Volume
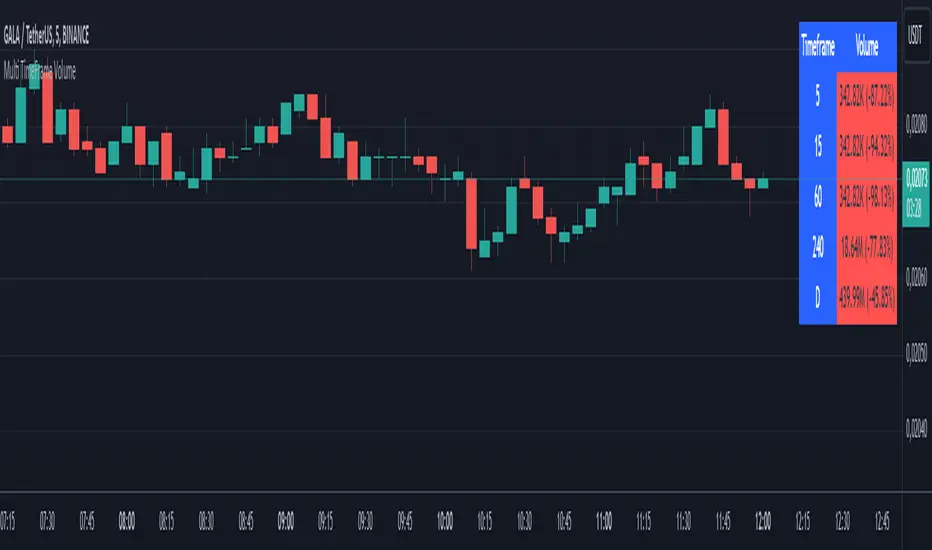
This script, "Multi TimeFrame Volume," is a TradingView Pine Script indicator that displays volume data across five user-selected timeframes in a table. Each volume is formatted in thousands (K) or millions (M) and color-coded based on the percentage change from the previous value (green for increase, red for decrease, gray if unchanged). The table's position and header colors can be customized. This helps traders quickly see volume trends at different intervals on a single chart
نص برمجي مفتوح المصدر
بروح TradingView الحقيقية، قام مبتكر هذا النص البرمجي بجعله مفتوح المصدر، بحيث يمكن للمتداولين مراجعة وظائفه والتحقق منها. شكرا للمؤلف! بينما يمكنك استخدامه مجانًا، تذكر أن إعادة نشر الكود يخضع لقواعد الموقع الخاصة بنا.
إخلاء المسؤولية
لا يُقصد بالمعلومات والمنشورات أن تكون، أو تشكل، أي نصيحة مالية أو استثمارية أو تجارية أو أنواع أخرى من النصائح أو التوصيات المقدمة أو المعتمدة من TradingView. اقرأ المزيد في شروط الاستخدام.