PROTECTED SOURCE SCRIPT
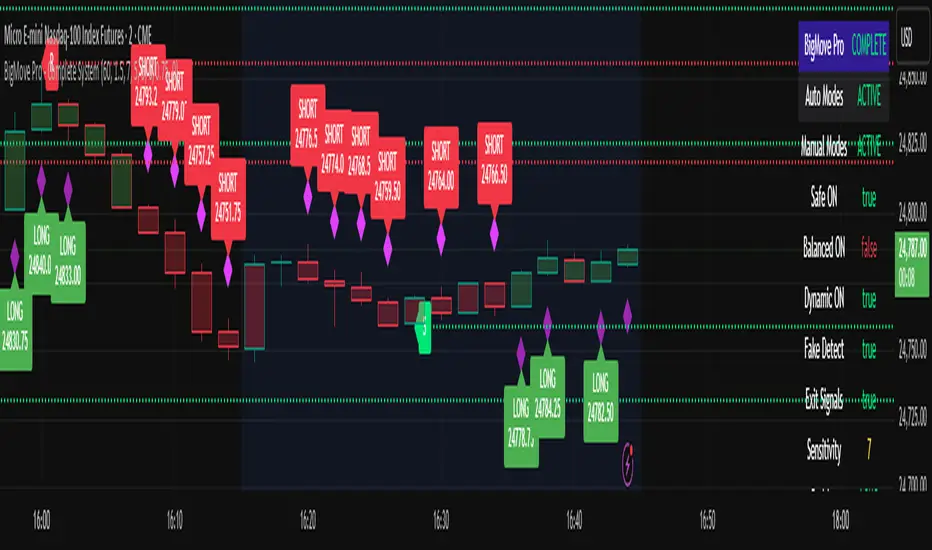
BigMove Pro - Complete System
Overview of the BigMove Indicator
The BigMove Indicator is a custom technical analysis tool designed to identify significant price movements or "breakouts" in a financial asset. Its core philosophy is to filter out market "noise" and highlight only those price changes that are substantial enough to signal a potential new trend or a powerful continuation.
The goal is to help traders catch major moves early and avoid getting whipsawed by minor, random fluctuations.
Likely Components and How It Works
While the exact formula can vary, a typical BigMove indicator often incorporates the following elements:
1. The "Big Move" Threshold:
The indicator calculates a dynamic threshold, usually based on a measure of recent market volatility. The most common method is using the Average True Range (ATR).
Logic: A "big move" shouldn't be a fixed price value (e.g., $1.00), because a $1 move is significant for a stock priced at $50 but negligible for one priced at $500. Using ATR makes the threshold adaptive.
Calculation: The threshold might be a multiple of the ATR (e.g., 1.5 x ATR(14) or 2.0 x ATR(20)). If the current price change (from the previous close, or from an opening level) exceeds this threshold, a "BigMove" is signaled.
2. Signal Generation:
The indicator provides clear visual and/or alert-based signals.
Buy Signal: Generated when the price makes a significant upward move beyond the positive threshold. This is often represented by a green arrow ↑ below the price bar/candle, or by coloring the price bar green.
Sell Signal: Generated when the price makes a significant downward move beyond the negative threshold. This is often represented by a red arrow ↓ above the price bar/candle, or by coloring the price bar red.
3. Confirmation Filters (Common in Sophisticated Versions):
To reduce false signals, your BigMove indicator might include one or more of these filters:
Volume Confirmation: The "big move" must be accompanied by high volume (e.g., volume greater than the 50-period moving average of volume). A breakout on low volume is less trustworthy.
Trend Filter: It might only show signals that align with a larger trend. For example, it might only show "Buy" signals when the price is above its 200-day Simple Moving Average (SMA) or "Sell" signals when below it.
How to Interpret the Signals
A Green "Buy" Signal: Suggests a strong bullish impulse. Traders might interpret this as an entry point for a long position or a signal that a consolidation period has ended and an uptrend is beginning.
A Red "Sell" Signal: Suggests a strong bearish impulse. Traders might interpret this as an entry point for a short position or an exit point for long positions, indicating a potential downtrend.
A Hypothetical Example
Let's assume your BigMove indicator is set to 2.0 x ATR(14).
Stock ABC has an ATR(14) of $1.50. Therefore, the BigMove threshold is 2.0 * $1.50 = $3.00.
The stock has been trading in a tight range around $100.
On a given day, it opens at $100.50 and rallies to close at $104.00.
The total range of the day is $3.50, which is greater than the $3.00 threshold.
Result: A Green BigMove "Buy" arrow would appear on the chart for that day.
نص برمجي محمي
تم نشر هذا النص البرمجي كمصدر مغلق. ومع ذلك، يمكنك استخدامه بحرية ودون أي قيود - تعرف على المزيد هنا.
إخلاء المسؤولية
لا يُقصد بالمعلومات والمنشورات أن تكون، أو تشكل، أي نصيحة مالية أو استثمارية أو تجارية أو أنواع أخرى من النصائح أو التوصيات المقدمة أو المعتمدة من TradingView. اقرأ المزيد في شروط الاستخدام.