OPEN-SOURCE SCRIPT
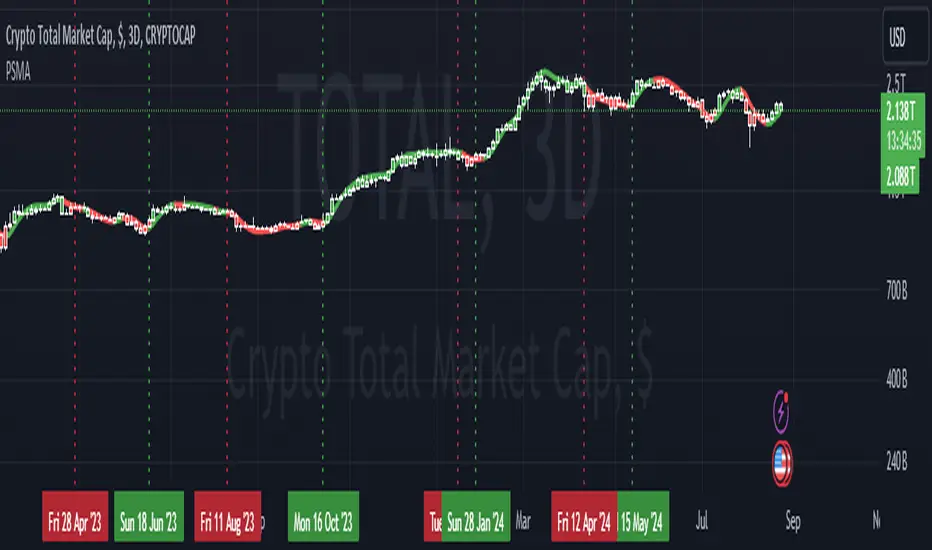
Price strength around MA

This indicatorit takes the HMA and calculates the difference between close and HMA. Within a lookback period it adds all values together where price is above/below the HMA. However, it squares the values before adding them together, so that larger differences have a bigger impact (this is to detect breakouts). After that it subtracts all the negative values from the positive ones so that in the end we have one single number that represents price behavior in the lookback period. This number is then added to the difference between an EMA and a SMA to produce the final signal of this indicator.
نص برمجي مفتوح المصدر
بروح TradingView الحقيقية، قام مبتكر هذا النص البرمجي بجعله مفتوح المصدر، بحيث يمكن للمتداولين مراجعة وظائفه والتحقق منها. شكرا للمؤلف! بينما يمكنك استخدامه مجانًا، تذكر أن إعادة نشر الكود يخضع لقواعد الموقع الخاصة بنا.
إخلاء المسؤولية
لا يُقصد بالمعلومات والمنشورات أن تكون، أو تشكل، أي نصيحة مالية أو استثمارية أو تجارية أو أنواع أخرى من النصائح أو التوصيات المقدمة أو المعتمدة من TradingView. اقرأ المزيد في شروط الاستخدام.