OPEN-SOURCE SCRIPT
Coefficient of Variation [DW]
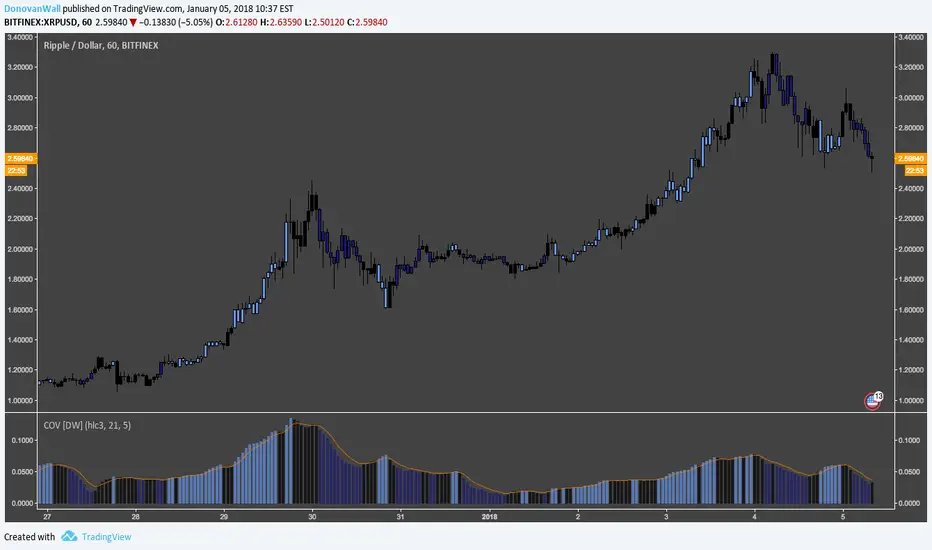
This is a simple gauge of volatility using the Coefficient of Variation.
COV is calculated by dividing standard deviation of price by the expected (average) price.
Custom color scheme indicates increases and decreases in volatility, which is indicated when the COV forms new half period highs and lows.
COV is calculated by dividing standard deviation of price by the expected (average) price.
Custom color scheme indicates increases and decreases in volatility, which is indicated when the COV forms new half period highs and lows.
نص برمجي مفتوح المصدر
بروح TradingView الحقيقية، قام مبتكر هذا النص البرمجي بجعله مفتوح المصدر، بحيث يمكن للمتداولين مراجعة وظائفه والتحقق منها. شكرا للمؤلف! بينما يمكنك استخدامه مجانًا، تذكر أن إعادة نشر الكود يخضع لقواعد الموقع الخاصة بنا.
For my full list of premium tools, check the blog:
wallanalytics.com/
Reach out on Telegram:
t.me/DonovanWall
wallanalytics.com/
Reach out on Telegram:
t.me/DonovanWall
إخلاء المسؤولية
لا يُقصد بالمعلومات والمنشورات أن تكون، أو تشكل، أي نصيحة مالية أو استثمارية أو تجارية أو أنواع أخرى من النصائح أو التوصيات المقدمة أو المعتمدة من TradingView. اقرأ المزيد في شروط الاستخدام.