OPEN-SOURCE SCRIPT
MACD LB MFI
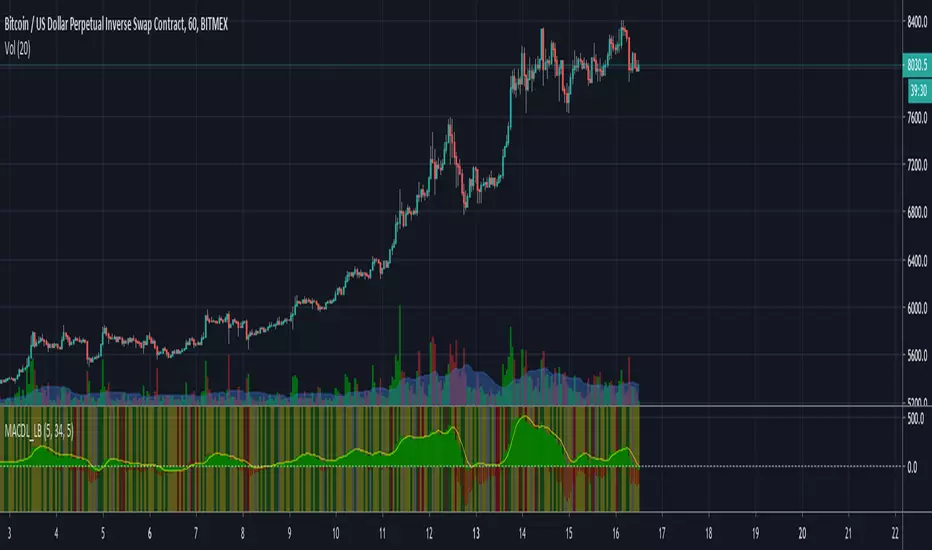
This script includes MACD histogram plus MFI in four states
All backgrounds are compared to previous bar in +/- 10%
1. Green (green) + Volume + Range (++)
2. Fading (yellow) - Volume - Range (--)
3. False (gray) - Volume + Range (-+)
4. Crouching (red) + Volume - Range (+-)
All backgrounds are compared to previous bar in +/- 10%
1. Green (green) + Volume + Range (++)
2. Fading (yellow) - Volume - Range (--)
3. False (gray) - Volume + Range (-+)
4. Crouching (red) + Volume - Range (+-)
نص برمجي مفتوح المصدر
بروح TradingView الحقيقية، قام مبتكر هذا النص البرمجي بجعله مفتوح المصدر، بحيث يمكن للمتداولين مراجعة وظائفه والتحقق منها. شكرا للمؤلف! بينما يمكنك استخدامه مجانًا، تذكر أن إعادة نشر الكود يخضع لقواعد الموقع الخاصة بنا.
إخلاء المسؤولية
لا يُقصد بالمعلومات والمنشورات أن تكون، أو تشكل، أي نصيحة مالية أو استثمارية أو تجارية أو أنواع أخرى من النصائح أو التوصيات المقدمة أو المعتمدة من TradingView. اقرأ المزيد في شروط الاستخدام.