PROTECTED SOURCE SCRIPT
تم تحديثه BTC Time Cycle
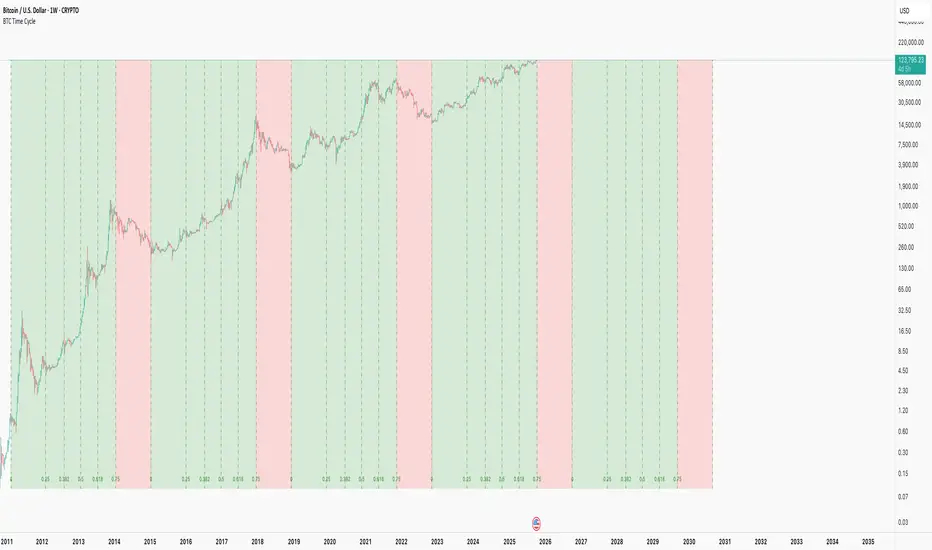
This indicator helps track Bitcoin's historical four-year cycles by dividing time from market bottoms into Fibonacci-based segments, providing clear visual cues for potential bullish and bearish phases.
How It Works: This indicator overlays repeating Fibonacci-based time cycles onto weekly BTC charts, plotting vertical lines at key Fib ratios (0, 0.25, 0.382, 0.5, 0.618, 0.75, 1.0) to track cycle progress. Each cycle concludes at 1.0 and seamlessly resets as the next cycle's 0, capturing historical trough-to-trough intervals like those observed from 2018 to 2022. The week preceding the 0.75 Fibonacci ratio typically signals the cycle peak and bear market onset, transitioning through the final phase until 1.0 initiates a new cycle.
Disclaimer: This pattern has consistently repeated in past cycles, but financial markets are inherently unpredictable—it is not guaranteed to persist and remains valid only until disproven. Treat it as an analytical aid, not a predictive certainty.
This is merely a curiosity and is: True until it isn't™
ملاحظات الأخبار
This indicator helps track Bitcoin's historical four-year cycles by dividing time from market bottoms into Fibonacci-based segments, providing clear visual cues for potential bullish and bearish phases.How It Works: This indicator overlays repeating Fibonacci-based time cycles onto weekly BTC charts, plotting vertical lines at key Fib ratios (0, 0.25, 0.382, 0.5, 0.618, 0.75, 1.0) to track cycle progress. Each cycle concludes at 1.0 and seamlessly resets as the next cycle's 0, capturing historical trough-to-trough intervals like those observed from 2018 to 2022. The week preceding the 0.75 Fibonacci ratio typically signals the cycle peak and bear market onset, transitioning through the final phase until 1.0 initiates a new cycle.
Disclaimer: This pattern has consistently repeated in past cycles, but financial markets are inherently unpredictable—it is not guaranteed to persist and remains valid only until disproven. Treat it as an analytical aid, not a predictive certainty.
This is merely a curiosity and is: True until it isn't™
نص برمجي محمي
تم نشر هذا النص البرمجي كمصدر مغلق. ومع ذلك، يمكنك استخدامه بحرية ودون أي قيود - تعرف على المزيد هنا.
إخلاء المسؤولية
لا يُقصد بالمعلومات والمنشورات أن تكون، أو تشكل، أي نصيحة مالية أو استثمارية أو تجارية أو أنواع أخرى من النصائح أو التوصيات المقدمة أو المعتمدة من TradingView. اقرأ المزيد في شروط الاستخدام.