OPEN-SOURCE SCRIPT
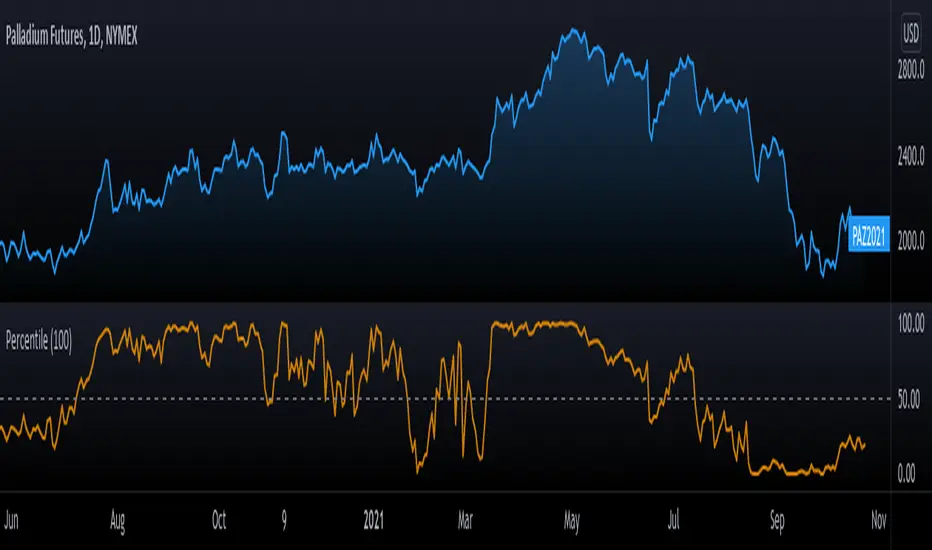
Percentile Rank [racer8]

The Percentile is a mathematical tool developed in the field of statistics. It determines how a value compares to a set of values.
There are many applications for this like ...
... determining your rank in your college math class
... your rank in terms of height, weight, economic status, etc.
... determining the 3-month percentile of the current stock price (which is what this indicator performs)
This indicator calculates the percentile rank for the current stock price for n periods.
For example, if the stock's current price is above 80% of the previous stock's prices over a 100-period span, then it has a percentile rank of 80.
For traders, this is extremely valuable information because it tells you if the current stock price is overbought or oversold.
If the stock's price is in the 95th percentile, then it is highly likely that it is OVERBOUGHT, and that it will revert back to the mean price.
Helplful TIP: I recommend that you set the indicator to look back over at LEAST 100 periods for accuracy!
Thanks for reading! 👍
نص برمجي مفتوح المصدر
بروح TradingView الحقيقية، قام مبتكر هذا النص البرمجي بجعله مفتوح المصدر، بحيث يمكن للمتداولين مراجعة وظائفه والتحقق منها. شكرا للمؤلف! بينما يمكنك استخدامه مجانًا، تذكر أن إعادة نشر الكود يخضع لقواعد الموقع الخاصة بنا.
إخلاء المسؤولية
لا يُقصد بالمعلومات والمنشورات أن تكون، أو تشكل، أي نصيحة مالية أو استثمارية أو تجارية أو أنواع أخرى من النصائح أو التوصيات المقدمة أو المعتمدة من TradingView. اقرأ المزيد في شروط الاستخدام.