OPEN-SOURCE SCRIPT
ATRCD, Average True Range Convergence Divergence
ATRCD calculates a MACD over the Average True Range, therefore helping traders to spot momentum in volatility.
The Average True Range is a measurement of the average candle size over a period of time, i.e. when the candles are small, the ATR is low. ATR measures volatility.
The MACD is a momentum indicator. It measures market momentum based on the average closing prices over a period.
Therefore, using the MACD calculation over the ATR we get a measurement of momentum in volatility. The ATRCD is a concept at this point. I was curious to see whether such an indicator could provide any edge trading the markets. Because this is a MACD of the ATR the same concepts can be applied, e.g. spotting divergences, momentum trends, etc. Please be careful however, this indicator only looks like the MACD but it measures volatility and not price momentum. Maybe this can help traders confirm breakouts using price action?
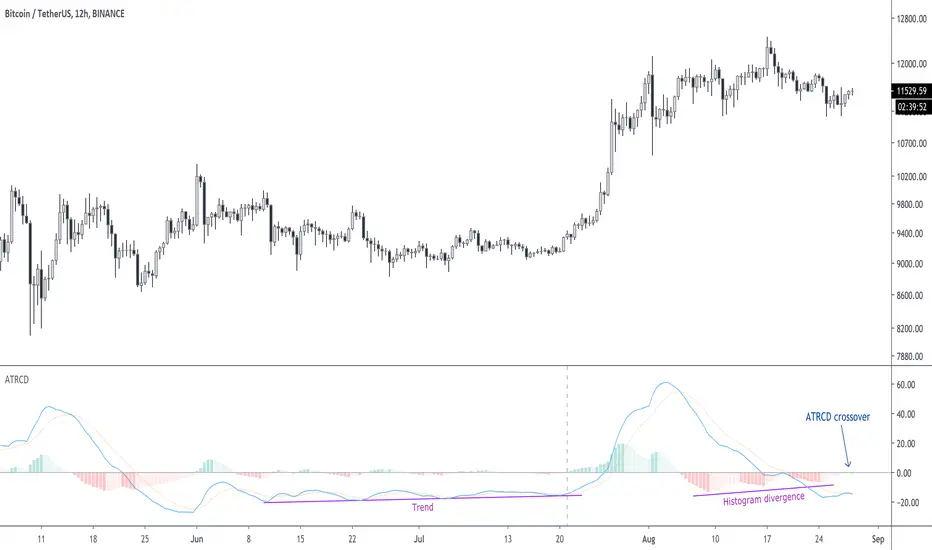
Applying this indicator to the 12h of BTC/USDT we can see that we could be nearing a volatility expansion with a divergence on the histogram, and an ATRCD crossover.


 BTCUSDT
The Average True Range is a measurement of the average candle size over a period of time, i.e. when the candles are small, the ATR is low. ATR measures volatility.
The MACD is a momentum indicator. It measures market momentum based on the average closing prices over a period.
Therefore, using the MACD calculation over the ATR we get a measurement of momentum in volatility. The ATRCD is a concept at this point. I was curious to see whether such an indicator could provide any edge trading the markets. Because this is a MACD of the ATR the same concepts can be applied, e.g. spotting divergences, momentum trends, etc. Please be careful however, this indicator only looks like the MACD but it measures volatility and not price momentum. Maybe this can help traders confirm breakouts using price action?
Applying this indicator to the 12h of BTC/USDT we can see that we could be nearing a volatility expansion with a divergence on the histogram, and an ATRCD crossover.
نص برمجي مفتوح المصدر
بروح TradingView الحقيقية، قام مبتكر هذا النص البرمجي بجعله مفتوح المصدر، بحيث يمكن للمتداولين مراجعة وظائفه والتحقق منها. شكرا للمؤلف! بينما يمكنك استخدامه مجانًا، تذكر أن إعادة نشر الكود يخضع لقواعد الموقع الخاصة بنا.
إخلاء المسؤولية
لا يُقصد بالمعلومات والمنشورات أن تكون، أو تشكل، أي نصيحة مالية أو استثمارية أو تجارية أو أنواع أخرى من النصائح أو التوصيات المقدمة أو المعتمدة من TradingView. اقرأ المزيد في شروط الاستخدام.