OPEN-SOURCE SCRIPT
تم تحديثه Asset Correlation
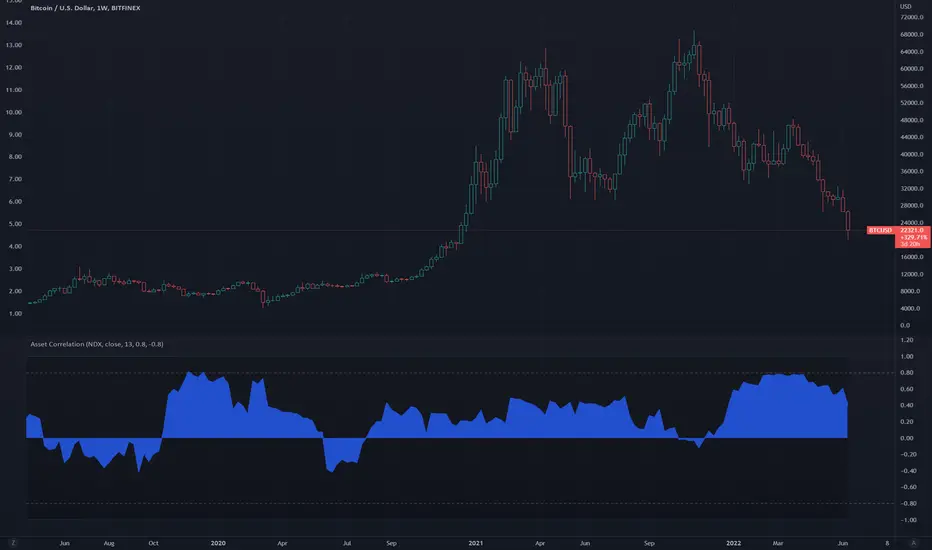
This indicator shows correlation strength between the source asset plotted in the main chart and a user-input asset in the indicator panel. For example, if the main chart panel is displaying BTCUSD and the correlation indicator is NDX, then the correlation strength is plotted as the relationship between the two. A strong positive correlation target is set at 0.80 but can be changed. A strong negative correlation target is set at -0.80 and can also be changed.
The indicator also has an option for a plot of the ta.correlation() function for a reference line.
The indicator also has an option for a plot of the ta.correlation() function for a reference line.
ملاحظات الأخبار
Changes as follows:- Fixed scale issue y axis for reference plot of ta.correlation(), which is hidden by default. As plots can’t be called from a local scope, the transparency of the plot is set to 100 when turned off which previously affected the y axis scale. Update sets ta.correlation() plot value to 0 and transparency to 100, when bShowTradingViewCorrelation is false.
نص برمجي مفتوح المصدر
بروح TradingView الحقيقية، قام مبتكر هذا النص البرمجي بجعله مفتوح المصدر، بحيث يمكن للمتداولين مراجعة وظائفه والتحقق منها. شكرا للمؤلف! بينما يمكنك استخدامه مجانًا، تذكر أن إعادة نشر الكود يخضع لقواعد الموقع الخاصة بنا.
إخلاء المسؤولية
لا يُقصد بالمعلومات والمنشورات أن تكون، أو تشكل، أي نصيحة مالية أو استثمارية أو تجارية أو أنواع أخرى من النصائح أو التوصيات المقدمة أو المعتمدة من TradingView. اقرأ المزيد في شروط الاستخدام.