OPEN-SOURCE SCRIPT
BDC - Bitcoin (BTC) Dominance Change [Logue]
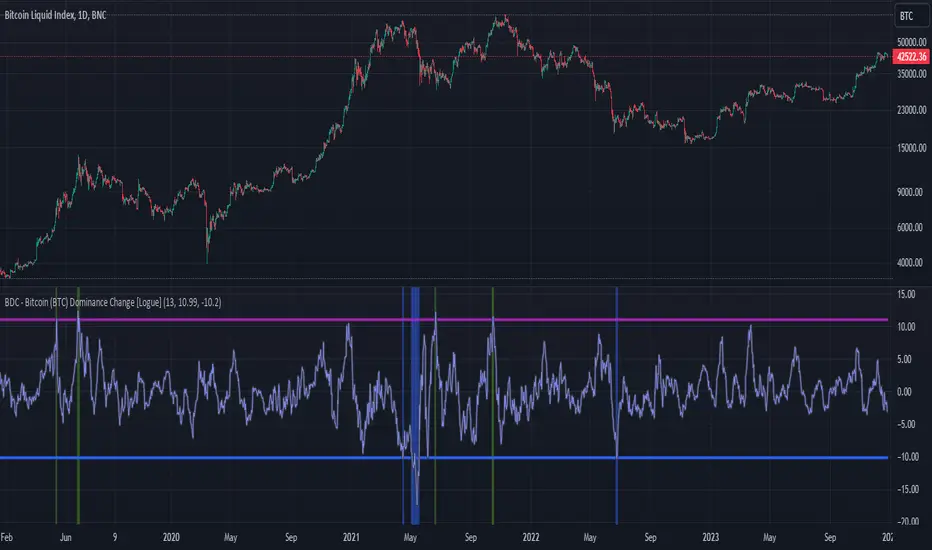
Bitcoin Dominance Change. Interesting things tend to happen when the Bitcoin dominance increases or decreases rapidly. Perhaps because there is overexuberance in the market in either BTC or the alts. In back testing, I found a rapid 13-day change in dominance indicates interesting switches in the BTC trends. Prior to 2019, the indicator doesn't work as well to signal trend shifts (i.e., local tops and bottoms) likely based on very few coins making up the crypto market.
The BTC dominance change is calculated as a percentage change of the daily dominance. You are able to change the upper bound, lower bound, and the period (daily) of the indicator to your own preferences. The indicator going above the upper bound or below the lower bound will trigger a different background color.
Use this indicator at your own risk. I make no claims as to its accuracy in forecasting future trend changes of Bitcoin.
نص برمجي مفتوح المصدر
بروح TradingView الحقيقية، قام مبتكر هذا النص البرمجي بجعله مفتوح المصدر، بحيث يمكن للمتداولين مراجعة وظائفه والتحقق منها. شكرا للمؤلف! بينما يمكنك استخدامه مجانًا، تذكر أن إعادة نشر الكود يخضع لقواعد الموقع الخاصة بنا.
إخلاء المسؤولية
لا يُقصد بالمعلومات والمنشورات أن تكون، أو تشكل، أي نصيحة مالية أو استثمارية أو تجارية أو أنواع أخرى من النصائح أو التوصيات المقدمة أو المعتمدة من TradingView. اقرأ المزيد في شروط الاستخدام.