OPEN-SOURCE SCRIPT
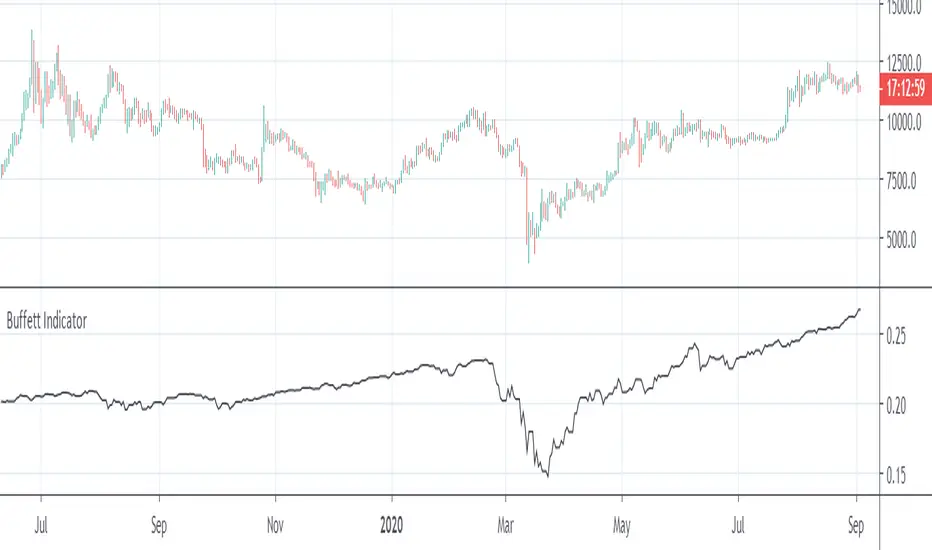
Buffett Indicator [Bitcoin Machine]

This is the Warren Buffett Indicator, the total market cap relative to the US gross domestic product (GDP). It is also called "Market Cap to GDP Indicator". For the market cap typically the Wilshire 5000 total market cap is used, which is representing the value of all stocks traded in the United States. Tradingview just provides the Wilshire W4500. We can calculate the W5000 by adding the S&P500 to the W4500.
Market Cap to GDP is a long-term valuation indicator and as pointed by Warren Buffett, the indicator is “probably the best single measure of where valuations stand at any given moment.” It used as a broad way of assessing whether the country’s stock market is overvalued or undervalued, compared to a historical average.
Remark: The Wilshire W4500 and the S&P500 are indices and denoted in "index points" (not USD). The Original Buffett Indicator is using market cap in US-Dollar. So the right scale of the indicator is different to the original one.
نص برمجي مفتوح المصدر
بروح TradingView الحقيقية، قام مبتكر هذا النص البرمجي بجعله مفتوح المصدر، بحيث يمكن للمتداولين مراجعة وظائفه والتحقق منها. شكرا للمؤلف! بينما يمكنك استخدامه مجانًا، تذكر أن إعادة نشر الكود يخضع لقواعد الموقع الخاصة بنا.
إخلاء المسؤولية
لا يُقصد بالمعلومات والمنشورات أن تكون، أو تشكل، أي نصيحة مالية أو استثمارية أو تجارية أو أنواع أخرى من النصائح أو التوصيات المقدمة أو المعتمدة من TradingView. اقرأ المزيد في شروط الاستخدام.