OPEN-SOURCE SCRIPT
Multi-Minute Interval Marker
Testing
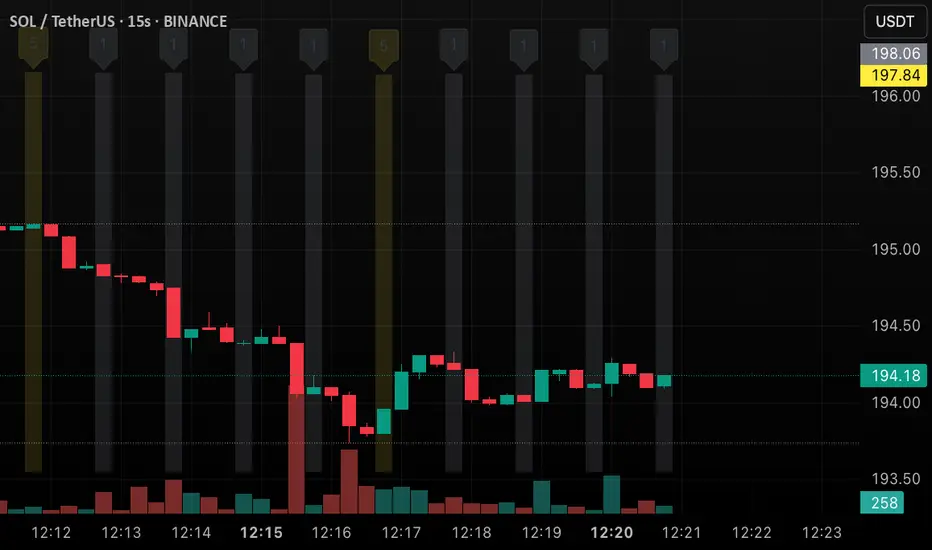
Apply this to a 15-second chart (e.g., SOL/USDT).
Verify that thin vertical lines with "1" (grey) and "5" (yellow) appear above the candles at 4-candle (1-minute) and 20-candle (5-minute) intervals, respectively.
The numbers should be positioned above the lines, and you can toggle the markers with show1Min and show5Min.
نص برمجي مفتوح المصدر
بروح TradingView الحقيقية، قام مبتكر هذا النص البرمجي بجعله مفتوح المصدر، بحيث يمكن للمتداولين مراجعة وظائفه والتحقق منها. شكرا للمؤلف! بينما يمكنك استخدامه مجانًا، تذكر أن إعادة نشر الكود يخضع لقواعد الموقع الخاصة بنا.
إخلاء المسؤولية
لا يُقصد بالمعلومات والمنشورات أن تكون، أو تشكل، أي نصيحة مالية أو استثمارية أو تجارية أو أنواع أخرى من النصائح أو التوصيات المقدمة أو المعتمدة من TradingView. اقرأ المزيد في شروط الاستخدام.