OPEN-SOURCE SCRIPT
تم تحديثه Connors RSI (ValueRay)
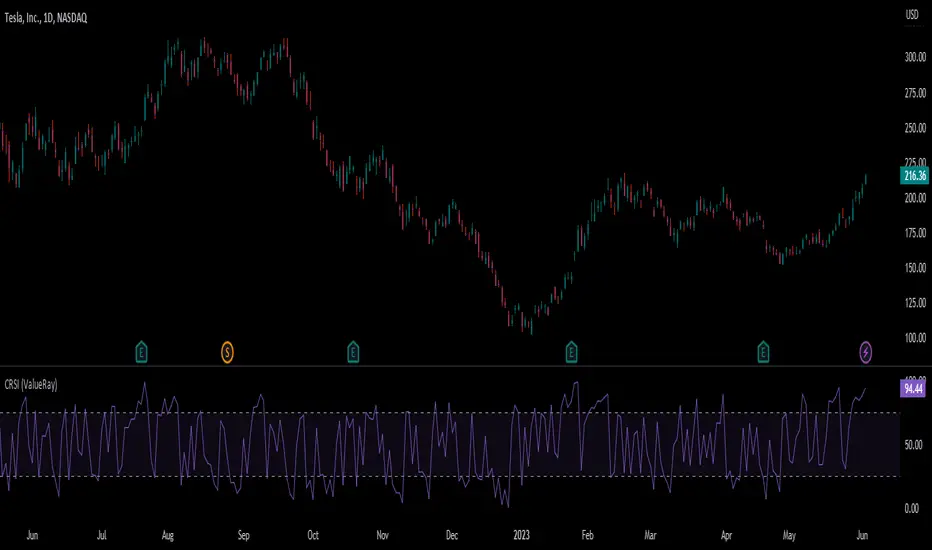
In compare to Tradingview Connors RSI, in this one you can choose which of the parts of the CRSI you want see:
The Connors RSI is a technical indicator developed by Larry Connors. It combines three different elements - price momentum, relative strength, and mean reversion - to identify potential buy and sell signals. The indicator measures the level of overbought or oversold conditions in a security, aiming to generate signals for short-term trading opportunities. It is widely used by traders to assess the strength and direction of price movements and to identify potential entry and exit points in the market.
- RSI
- Connors RSI
- Up/Down RSI
- Percent Rank
The Connors RSI is a technical indicator developed by Larry Connors. It combines three different elements - price momentum, relative strength, and mean reversion - to identify potential buy and sell signals. The indicator measures the level of overbought or oversold conditions in a security, aiming to generate signals for short-term trading opportunities. It is widely used by traders to assess the strength and direction of price movements and to identify potential entry and exit points in the market.
ملاحظات الأخبار
- removed link (house rules policy)
نص برمجي مفتوح المصدر
بروح TradingView الحقيقية، قام مبتكر هذا النص البرمجي بجعله مفتوح المصدر، بحيث يمكن للمتداولين مراجعة وظائفه والتحقق منها. شكرا للمؤلف! بينما يمكنك استخدامه مجانًا، تذكر أن إعادة نشر الكود يخضع لقواعد الموقع الخاصة بنا.
ValueRay ➤ AI driven Stock Screener and Value Analyser
إخلاء المسؤولية
لا يُقصد بالمعلومات والمنشورات أن تكون، أو تشكل، أي نصيحة مالية أو استثمارية أو تجارية أو أنواع أخرى من النصائح أو التوصيات المقدمة أو المعتمدة من TradingView. اقرأ المزيد في شروط الاستخدام.