OPEN-SOURCE SCRIPT
Triple Weekly Moving Average

Triple Weekly Moving Average
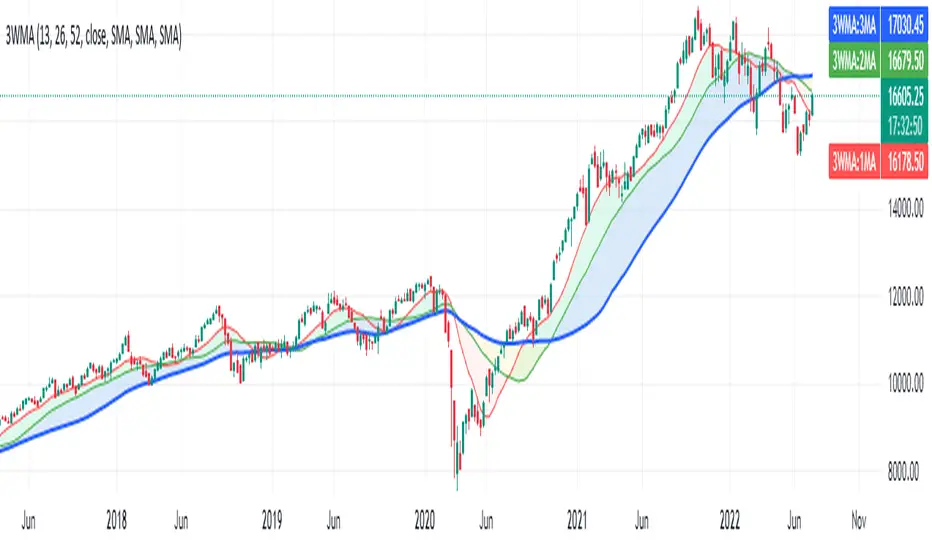
The default settings plot 3 weekly moving averages [SMA] for 13, 26 and 52 weeks, for analyzing Short (Quarterly), Medium (Semester) and long term (Yearly) view.
Idea is when the three moving averages are aligned, the security is in trend and when they crisscross the security may be either turning, slowing down or stalling, however, this must be correlated with other studies.
Started observing half yearly moving average after reading Stan Weinstein's Secrets For Profiting in Bull and Bear Markets.
The settings of the indicator are pretty self explanatory. The indicator gives an option to select lookahead, however, change it only when you are well aware of the consequences, the default setting is Turned Off, please follow TV user guide for a detailed explanation on lookahead. I added it as I was plotting this script on Daily timeframe and wanted to observe the changes.
نص برمجي مفتوح المصدر
بروح TradingView الحقيقية، قام مبتكر هذا النص البرمجي بجعله مفتوح المصدر، بحيث يمكن للمتداولين مراجعة وظائفه والتحقق منها. شكرا للمؤلف! بينما يمكنك استخدامه مجانًا، تذكر أن إعادة نشر الكود يخضع لقواعد الموقع الخاصة بنا.
إخلاء المسؤولية
لا يُقصد بالمعلومات والمنشورات أن تكون، أو تشكل، أي نصيحة مالية أو استثمارية أو تجارية أو أنواع أخرى من النصائح أو التوصيات المقدمة أو المعتمدة من TradingView. اقرأ المزيد في شروط الاستخدام.