PROTECTED SOURCE SCRIPT
Tonislonis Reversals

Hello,
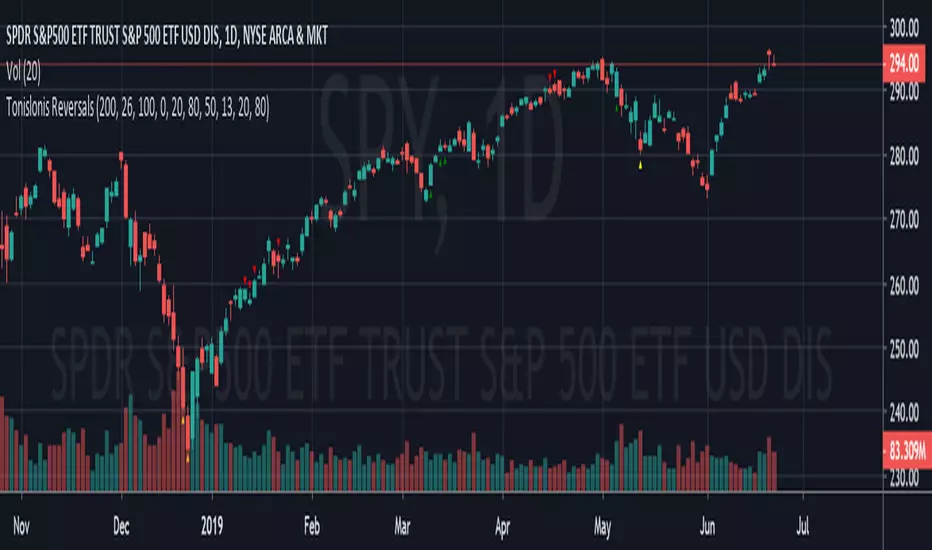
so this is one of my so called "algos", which I crafted to give me indication of one certain pattern happening. I saw that this "pattern" had some pretty nice returns, if you use it on daily chart on big cap stocks and mix it with order flow or unusual option activity (sweeps).
Best entries happen when the yellow triangle appears little bit away from 13 EMA. Check the order flow and if everything looks like you have an edge, then take a trade and take profit near 13 EMA.
Not gonna share any code, because it's my magical "black box", which I built and be grateful that I'm even publishing it. Not gonna share anymore information about this. Just if you like it then use it and if not then don't.
Now go out there and make a living from it taking trades as some freaking yellow triangles show you entries lol.
نص برمجي محمي
تم نشر هذا النص البرمجي كمصدر مغلق. ومع ذلك، يمكنك استخدامه بحرية ودون أي قيود - تعرف على المزيد هنا.
إخلاء المسؤولية
لا يُقصد بالمعلومات والمنشورات أن تكون، أو تشكل، أي نصيحة مالية أو استثمارية أو تجارية أو أنواع أخرى من النصائح أو التوصيات المقدمة أو المعتمدة من TradingView. اقرأ المزيد في شروط الاستخدام.