OPEN-SOURCE SCRIPT
NavCoin Swaps

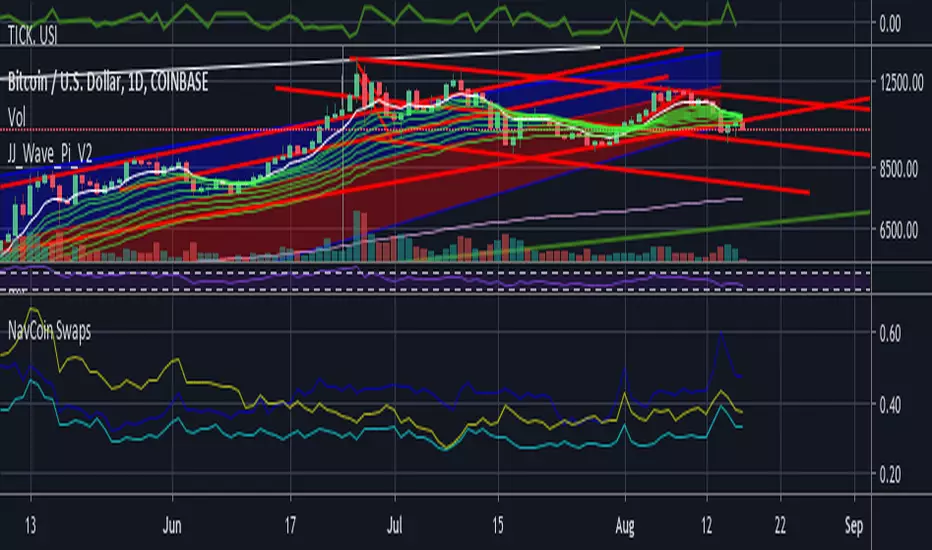
Simple line chart showing the price of navcoin swaps against three other similarly 'small cap' cryptos that are competing in similar space. PIVX, MTL, and ARK. Double-click the line or click the settings icon to change colors etc.
All are Nav / Othercoin, so a line moving up means othercoin is losing value relative to Nav, and down means of course the other coin is now worth more Nav.
All are Nav / Othercoin, so a line moving up means othercoin is losing value relative to Nav, and down means of course the other coin is now worth more Nav.
نص برمجي مفتوح المصدر
بروح TradingView الحقيقية، قام مبتكر هذا النص البرمجي بجعله مفتوح المصدر، بحيث يمكن للمتداولين مراجعة وظائفه والتحقق منها. شكرا للمؤلف! بينما يمكنك استخدامه مجانًا، تذكر أن إعادة نشر الكود يخضع لقواعد الموقع الخاصة بنا.
إخلاء المسؤولية
لا يُقصد بالمعلومات والمنشورات أن تكون، أو تشكل، أي نصيحة مالية أو استثمارية أو تجارية أو أنواع أخرى من النصائح أو التوصيات المقدمة أو المعتمدة من TradingView. اقرأ المزيد في شروط الاستخدام.