OPEN-SOURCE SCRIPT
تم تحديثه Draw swing Lines based on SMA
// Draw swing Lines based on SMA
// Each swing line must cross SMA
// ---------------------------------------------------
// Input:
// sma(Number): Default 50;
// showSMA: Default 'true'; if showSMA ='false', do not show SMA line;
// Deviation(%): Default "1"; To draw a new swing line, Price must cross SMA more than (n% of SMA)
// In weekly chart, better use "2" or more to avoid small ZigZag;
// ---------------------------------------------------
// This swing Lines could be used:
// 1. Verify reversal pattern, such as, double tops;
// 2. Help to draw accurate trend line, avoid noice; Set showSMA=false, to see trend line clearly;
// 3. Use two of this study together with different SMA, Set showSMA=false,
// Such as, SMA20 and SMA200, to see small waves in bigger wave
// ---------------------------------------------------
// In this sample Chart -- AMD 1h (Feb to Jun 2020)
// Added this study with SMA(50),
// Hide price chart and SMA line, to show the Swing line only,
// I drew some sample trend lines, and identified one Double top;
ملاحظات الأخبار
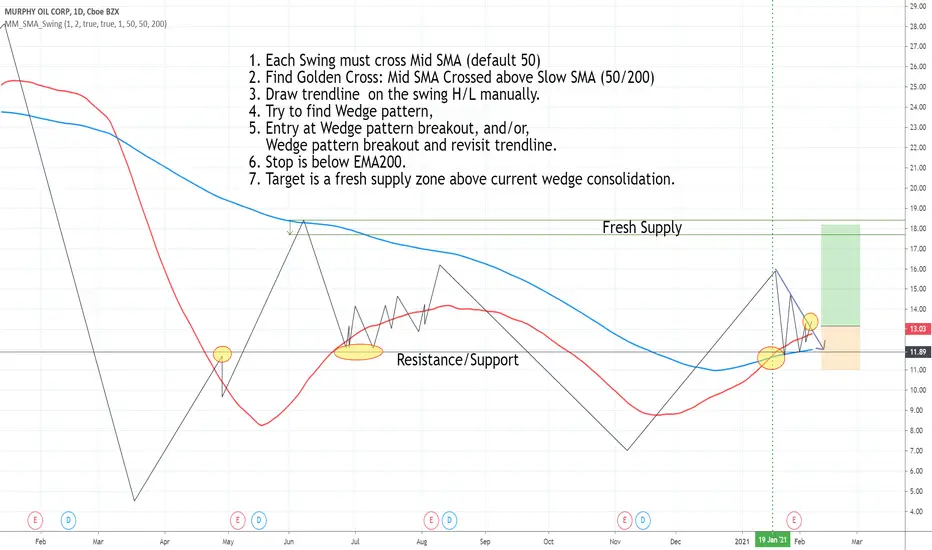
Add SMA 200 to help verify trend. when SMA50>SMA200, it is uptrend.ملاحظات الأخبار
Add SMA200 to show SMA50/200 relation for trend direction. ملاحظات الأخبار
Add SMA200, To find Golden cross for long entry.نص برمجي مفتوح المصدر
بروح TradingView الحقيقية، قام مبتكر هذا النص البرمجي بجعله مفتوح المصدر، بحيث يمكن للمتداولين مراجعة وظائفه والتحقق منها. شكرا للمؤلف! بينما يمكنك استخدامه مجانًا، تذكر أن إعادة نشر الكود يخضع لقواعد الموقع الخاصة بنا.
إخلاء المسؤولية
لا يُقصد بالمعلومات والمنشورات أن تكون، أو تشكل، أي نصيحة مالية أو استثمارية أو تجارية أو أنواع أخرى من النصائح أو التوصيات المقدمة أو المعتمدة من TradingView. اقرأ المزيد في شروط الاستخدام.
نص برمجي مفتوح المصدر
بروح TradingView الحقيقية، قام مبتكر هذا النص البرمجي بجعله مفتوح المصدر، بحيث يمكن للمتداولين مراجعة وظائفه والتحقق منها. شكرا للمؤلف! بينما يمكنك استخدامه مجانًا، تذكر أن إعادة نشر الكود يخضع لقواعد الموقع الخاصة بنا.
إخلاء المسؤولية
لا يُقصد بالمعلومات والمنشورات أن تكون، أو تشكل، أي نصيحة مالية أو استثمارية أو تجارية أو أنواع أخرى من النصائح أو التوصيات المقدمة أو المعتمدة من TradingView. اقرأ المزيد في شروط الاستخدام.