OPEN-SOURCE SCRIPT
تم تحديثه Essa - Yearly High, Low & Mid

Yearly High, Low & Midpoint Indicator
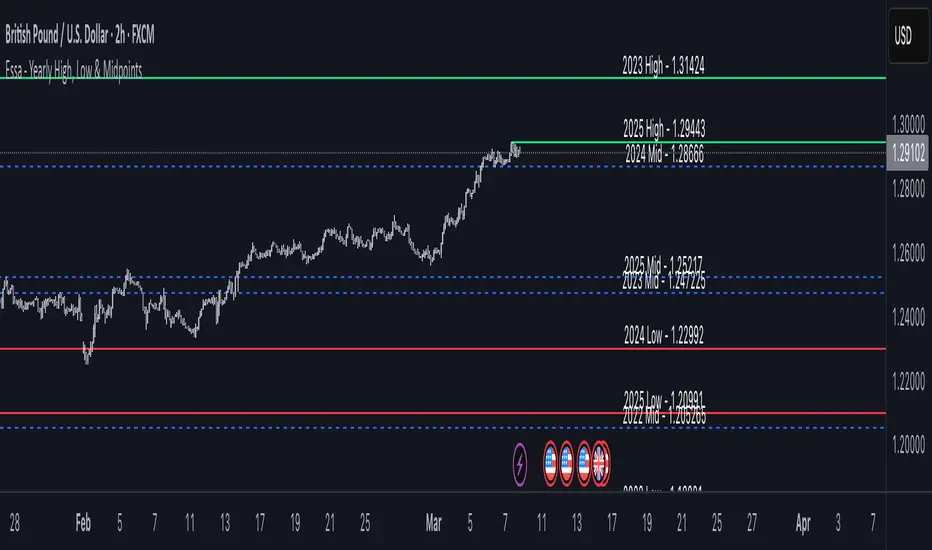
This TradingView indicator helps traders track key yearly price levels by plotting the high, low, and midpoint values for each year within a user-specified range.
Features & Functionality:
Automatic Yearly Calculation: Determines the highest and lowest price for each year and computes the midpoint as their average.
Clear & Customisable Visuals:
Detailed Labels:
Each level is labeled at the far right of the chart, showing the year, level type (High, Low, or Mid), and price (e.g., 2016 High - 1.20000).
Labels are right-aligned in white, ensuring clear visibility against any background.
This indicator is perfect for traders who rely on long-term technical analysis, providing a quick and structured way to visualise significant yearly price levels.
This TradingView indicator helps traders track key yearly price levels by plotting the high, low, and midpoint values for each year within a user-specified range.
Features & Functionality:
Automatic Yearly Calculation: Determines the highest and lowest price for each year and computes the midpoint as their average.
Clear & Customisable Visuals:
- The Yearly High is plotted as a solid green line.
- The Yearly Low appears as a solid red line.
- The Midpoint is displayed as a blue dashed line for easy distinction
Detailed Labels:
Each level is labeled at the far right of the chart, showing the year, level type (High, Low, or Mid), and price (e.g., 2016 High - 1.20000).
Labels are right-aligned in white, ensuring clear visibility against any background.
This indicator is perfect for traders who rely on long-term technical analysis, providing a quick and structured way to visualise significant yearly price levels.
ملاحظات الأخبار
Minor Updateنص برمجي مفتوح المصدر
بروح TradingView الحقيقية، قام مبتكر هذا النص البرمجي بجعله مفتوح المصدر، بحيث يمكن للمتداولين مراجعة وظائفه والتحقق منها. شكرا للمؤلف! بينما يمكنك استخدامه مجانًا، تذكر أن إعادة نشر الكود يخضع لقواعد الموقع الخاصة بنا.
إخلاء المسؤولية
لا يُقصد بالمعلومات والمنشورات أن تكون، أو تشكل، أي نصيحة مالية أو استثمارية أو تجارية أو أنواع أخرى من النصائح أو التوصيات المقدمة أو المعتمدة من TradingView. اقرأ المزيد في شروط الاستخدام.
نص برمجي مفتوح المصدر
بروح TradingView الحقيقية، قام مبتكر هذا النص البرمجي بجعله مفتوح المصدر، بحيث يمكن للمتداولين مراجعة وظائفه والتحقق منها. شكرا للمؤلف! بينما يمكنك استخدامه مجانًا، تذكر أن إعادة نشر الكود يخضع لقواعد الموقع الخاصة بنا.
إخلاء المسؤولية
لا يُقصد بالمعلومات والمنشورات أن تكون، أو تشكل، أي نصيحة مالية أو استثمارية أو تجارية أو أنواع أخرى من النصائح أو التوصيات المقدمة أو المعتمدة من TradingView. اقرأ المزيد في شروط الاستخدام.