OPEN-SOURCE SCRIPT
Tripple BB_13EMA
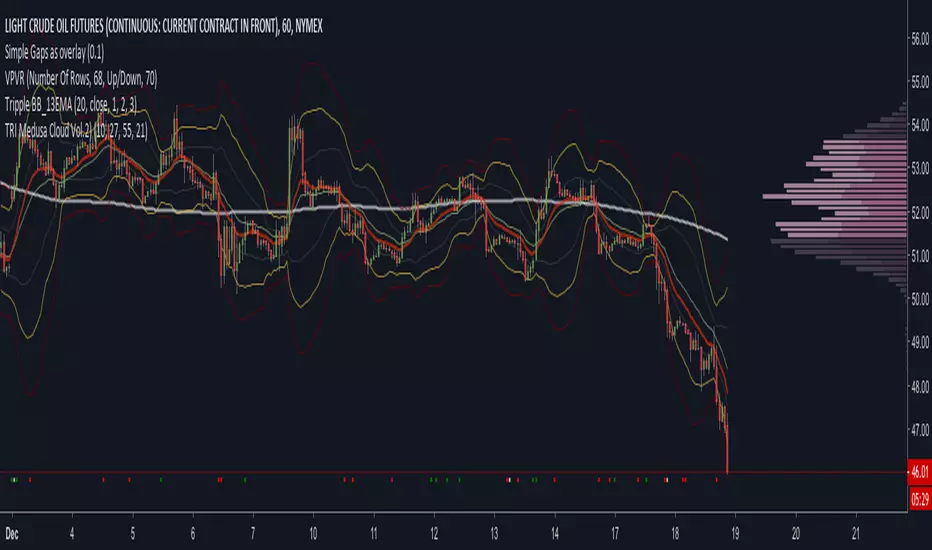
Here is a script to use 3 types of Bollinger Bands.
It is like three resistances or ranges in wich the Chart generally likes to move. A 1, 2 and 3 Width BB. The Chart moves 90% between the yellow one.
As support for my study i use the 13 EMA. is the Chart over the 13 EMA and under the Yellow (2) BB the trend is bullish. Is t under the 13 EMA and over the Yellow BB the trend used to be bearish.
The opener the BB are the more Volatilaty and the more likely the Chart will not bounce against the Bands. It will more get stick to the yellow or red one (if it is between them it is a trend too) and will follow up or downwards.
Check it out
نص برمجي مفتوح المصدر
بروح TradingView الحقيقية، قام مبتكر هذا النص البرمجي بجعله مفتوح المصدر، بحيث يمكن للمتداولين مراجعة وظائفه والتحقق منها. شكرا للمؤلف! بينما يمكنك استخدامه مجانًا، تذكر أن إعادة نشر الكود يخضع لقواعد الموقع الخاصة بنا.
Murat Oers (CFTe)
إخلاء المسؤولية
لا يُقصد بالمعلومات والمنشورات أن تكون، أو تشكل، أي نصيحة مالية أو استثمارية أو تجارية أو أنواع أخرى من النصائح أو التوصيات المقدمة أو المعتمدة من TradingView. اقرأ المزيد في شروط الاستخدام.