Profit Accumulator Heat Map
This is a support indicator to the Main Indicator which has also been published.
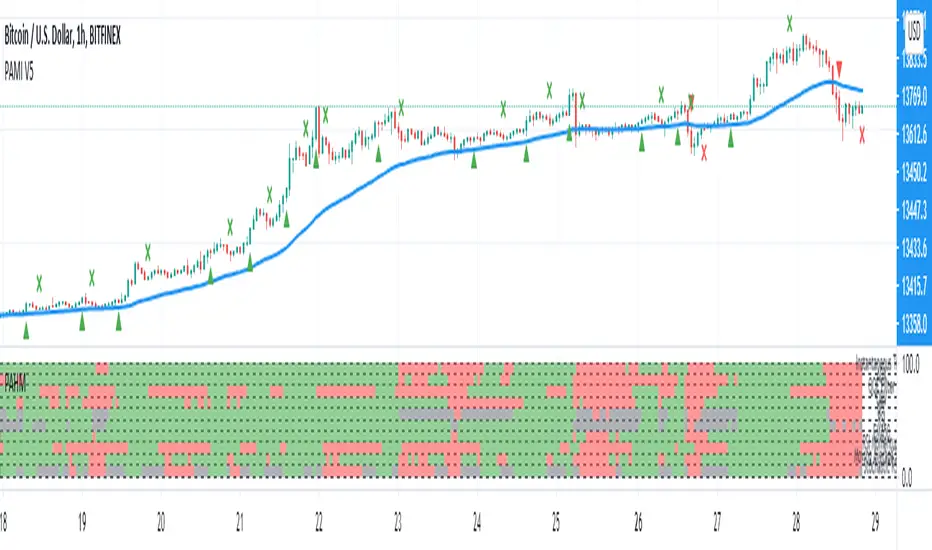
This is a list of a number of indicators which cover trend, momentum and volatility. The key is very simple for this indicator, green is a long trade, red is a short trade and grey is an indicator which may be transitioning. The indicators uses are: MACD, PSAR, Bollinger Bands, RSI, Momentum and Chandelier Exit. All of the settings are customisable within the indicator and the user can best fit these around their charts. The simplicity of the heat map is that the more of one colour there is, the more likely it is that a trade can be placed.
I've been using this successfully on the one hour FX charts, but seems to work equally as well on higher or lower time frames (not less than 15min).
The other indicators which are part of the suite are shown on the website which is highlighted in my signature at the bottom of the page. Purchase of the main indicator gives access to the full suite of eight indicators. I use the other indicators to confirm the direction of the trade and to determine if I want to trade or not. I use it along with the 2min, 15min and 4hr timeframes to identify the best entry window and how long I'm likely to be in the trade.
Support can be provided via private message or in the comments below.
The links are provided below for access to the indicator.
When there are at least six greens in a vertical line, this would indicate a buy signal. When there at least five reds/grays in a vertical line this would indicate a buy exit point.
Similarly, when there are at least six reds in a vertical line, this would indicate a sell signal. When there at least five greens/grays in a vertical line this would indicate a sell exit point.
The heat map is great for those basic users of Trading View who can get a snapshot multiple indicators and decide/determine to make a trade.
The heat map can be used with the main indicator to confirm if a buy or sell signal is valid or not.
نص برمجي للمستخدمين المدعوين فقط
يمكن فقط للمستخدمين الذين تمت الموافقة عليهم من قبل المؤلف الوصول إلى هذا البرنامج النصي. ستحتاج إلى طلب الإذن والحصول عليه لاستخدامه. يتم منح هذا عادةً بعد الدفع. لمزيد من التفاصيل، اتبع تعليمات المؤلف أدناه أو اتصل Mikeo82 مباشرة.
لا توصي TradingView بالدفع مقابل برنامج نصي أو استخدامه إلا إذا كنت تثق تمامًا في مؤلفه وتفهم كيفية عمله. يمكنك أيضًا العثور على بدائل مجانية ومفتوحة المصدر في نصوص مجتمعنا.
تعليمات المؤلف
إخلاء المسؤولية
نص برمجي للمستخدمين المدعوين فقط
يمكن فقط للمستخدمين الذين تمت الموافقة عليهم من قبل المؤلف الوصول إلى هذا البرنامج النصي. ستحتاج إلى طلب الإذن والحصول عليه لاستخدامه. يتم منح هذا عادةً بعد الدفع. لمزيد من التفاصيل، اتبع تعليمات المؤلف أدناه أو اتصل Mikeo82 مباشرة.
لا توصي TradingView بالدفع مقابل برنامج نصي أو استخدامه إلا إذا كنت تثق تمامًا في مؤلفه وتفهم كيفية عمله. يمكنك أيضًا العثور على بدائل مجانية ومفتوحة المصدر في نصوص مجتمعنا.