OPEN-SOURCE SCRIPT
تم تحديثه Bands Vision-X
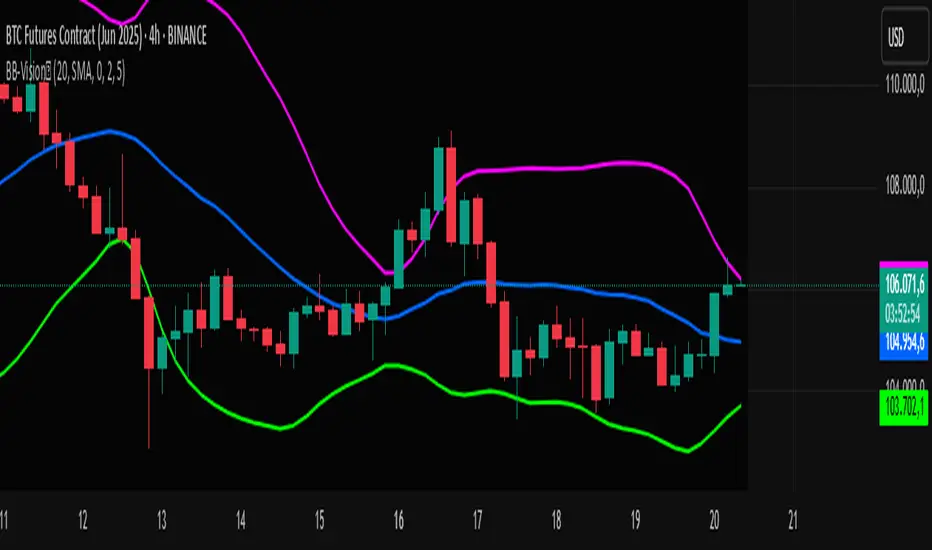
Bands Vision-X (BB-Vision-X) – Full Description
Description:
Bands Vision-X is an indicator based on dynamic bands constructed from customizable moving averages and standard deviation, allowing you to visualize potential support and resistance zones, volatility, and market conditions. It uses an adjustable moving average (with multiple options such as SMA, EMA, WMA, JMA, LSMA, DEMA, and TEMA) to define the central line, and upper and lower bands calculated by standard deviation multiplied by an adjustable factor. The bands are smoothed by a Hull Moving Average (HMA) to reduce noise and improve clarity.
How to Use
The bands indicate potential support and resistance levels.
The central line serves as a dynamic price reference.
The distance between bands reflects market volatility.
Touches or breakouts of the bands may signal entry or exit opportunities.
Parameters
Parameter Description Default
Standard Error Band Period Period for moving average and standard deviation 20
Moving Average Type Type of moving average (SMA, EMA, etc.) SMA
Standard Deviation Multiplier Multiplier for standard deviation 2.0
Band Lines Smoothing Period Period for smoothing the bands (HMA) 5
Technical Notes
The JMA function used is not the original Jurik version but an approximate and open implementation based on publicly available TradingView community code.
Developed in Pine Script v6 with optimized and clean code.
Recommendations
Ideal for traders seeking a clear view of volatility and dynamic support/resistance levels.
Should not be used in isolation; it is recommended to combine with volume analysis, price action, or other technical indicators.
Adjust the period and multiplier according to the asset and timeframe for better effectiveness.
ملاحظات الأخبار
Update: RGB colors were added to the lines. The background color is black with an adjustable offset from 0 to 20 (I use 4, but it’s up to you). To avoid using the background color directly, a transparency from 100 (fully transparent) to 0 is applied. Setting the transparency to 0 effectively disables the background color.ملاحظات الأخبار
Update colors thanks ملاحظات الأخبار
update: We made an update by adding signal dots to help better interpret the signals of the Bands Bollinger indicator.ملاحظات الأخبار
Update and improvements to the indicatorنص برمجي مفتوح المصدر
بروح TradingView الحقيقية، قام مبتكر هذا النص البرمجي بجعله مفتوح المصدر، بحيث يمكن للمتداولين مراجعة وظائفه والتحقق منها. شكرا للمؤلف! بينما يمكنك استخدامه مجانًا، تذكر أن إعادة نشر الكود يخضع لقواعد الموقع الخاصة بنا.
إخلاء المسؤولية
لا يُقصد بالمعلومات والمنشورات أن تكون، أو تشكل، أي نصيحة مالية أو استثمارية أو تجارية أو أنواع أخرى من النصائح أو التوصيات المقدمة أو المعتمدة من TradingView. اقرأ المزيد في شروط الاستخدام.
نص برمجي مفتوح المصدر
بروح TradingView الحقيقية، قام مبتكر هذا النص البرمجي بجعله مفتوح المصدر، بحيث يمكن للمتداولين مراجعة وظائفه والتحقق منها. شكرا للمؤلف! بينما يمكنك استخدامه مجانًا، تذكر أن إعادة نشر الكود يخضع لقواعد الموقع الخاصة بنا.
إخلاء المسؤولية
لا يُقصد بالمعلومات والمنشورات أن تكون، أو تشكل، أي نصيحة مالية أو استثمارية أو تجارية أو أنواع أخرى من النصائح أو التوصيات المقدمة أو المعتمدة من TradingView. اقرأ المزيد في شروط الاستخدام.