PROTECTED SOURCE SCRIPT
تم تحديثه Configurable Yield Curve
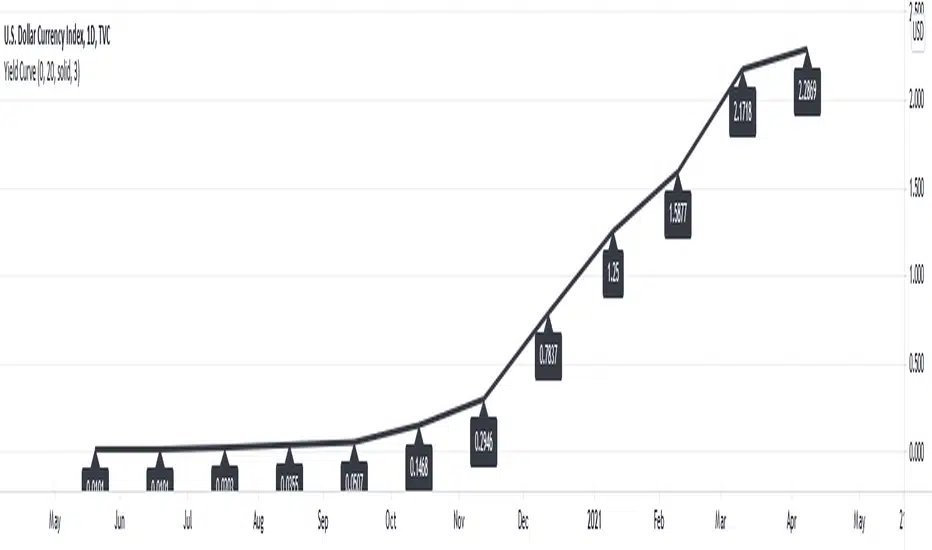
This script draws the US Yield Curve (one month to 30 years). It can be configured to show earlier values using the "Yield values from x bars before" parameter. A value of five and chart time zone "1 day" will show the Yield Curve as it was five days ago. In addition, style settings of the Yield Curve line and the labels can be configured. The drawing engine is also optimized to reduce local and server-side computations.
ملاحظات الأخبار
Added configuration options to include/exclude segments of the yield curve.نص برمجي محمي
تم نشر هذا النص البرمجي كمصدر مغلق. ومع ذلك، يمكنك استخدامه بحرية ودون أي قيود - تعرف على المزيد هنا.
إخلاء المسؤولية
لا يُقصد بالمعلومات والمنشورات أن تكون، أو تشكل، أي نصيحة مالية أو استثمارية أو تجارية أو أنواع أخرى من النصائح أو التوصيات المقدمة أو المعتمدة من TradingView. اقرأ المزيد في شروط الاستخدام.
نص برمجي محمي
تم نشر هذا النص البرمجي كمصدر مغلق. ومع ذلك، يمكنك استخدامه بحرية ودون أي قيود - تعرف على المزيد هنا.
إخلاء المسؤولية
لا يُقصد بالمعلومات والمنشورات أن تكون، أو تشكل، أي نصيحة مالية أو استثمارية أو تجارية أو أنواع أخرى من النصائح أو التوصيات المقدمة أو المعتمدة من TradingView. اقرأ المزيد في شروط الاستخدام.