OPEN-SOURCE SCRIPT
Volatility Index Oscillator SmallCap [aamonkey]
There are two versions of this indicator (Large and Small Cap).
Both work exactly the same the only difference are the default coins selected (and this version compares only 9 coins in total instead of 10).
What does this indicator do?
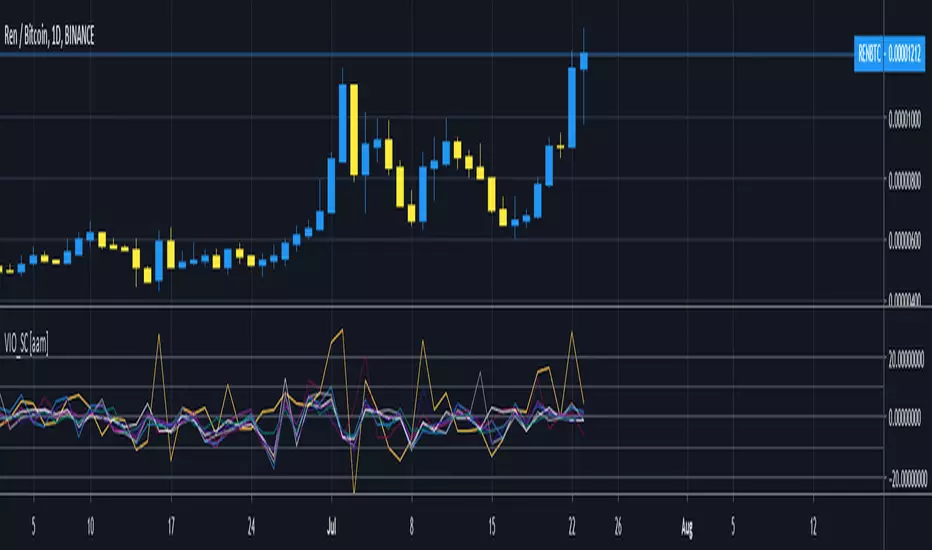
- can be used on any timeframe
- plots the percentage change of the candles of the selected timeframe of 8 SmallCap coins (Default: REN, LOOM, MANA, ENJ , KNC, ZRX, BNT, REP)
- +1 line for the chart you are currently on (Default: red line)
Why use this indicator:
- compare selected coins to the SmallCap coins in terms of volatility
- see correlations in price movements
- see which coin outperforms the others
- find coins that are behind
Settings:
- pairs, exchanges, and colors changeable
- always write the pairs and exchanges in caps!
Both work exactly the same the only difference are the default coins selected (and this version compares only 9 coins in total instead of 10).
What does this indicator do?
- can be used on any timeframe
- plots the percentage change of the candles of the selected timeframe of 8 SmallCap coins (Default: REN, LOOM, MANA, ENJ , KNC, ZRX, BNT, REP)
- +1 line for the chart you are currently on (Default: red line)
Why use this indicator:
- compare selected coins to the SmallCap coins in terms of volatility
- see correlations in price movements
- see which coin outperforms the others
- find coins that are behind
Settings:
- pairs, exchanges, and colors changeable
- always write the pairs and exchanges in caps!
نص برمجي مفتوح المصدر
بروح TradingView الحقيقية، قام مبتكر هذا النص البرمجي بجعله مفتوح المصدر، بحيث يمكن للمتداولين مراجعة وظائفه والتحقق منها. شكرا للمؤلف! بينما يمكنك استخدامه مجانًا، تذكر أن إعادة نشر الكود يخضع لقواعد الموقع الخاصة بنا.
إخلاء المسؤولية
لا يُقصد بالمعلومات والمنشورات أن تكون، أو تشكل، أي نصيحة مالية أو استثمارية أو تجارية أو أنواع أخرى من النصائح أو التوصيات المقدمة أو المعتمدة من TradingView. اقرأ المزيد في شروط الاستخدام.