OPEN-SOURCE SCRIPT
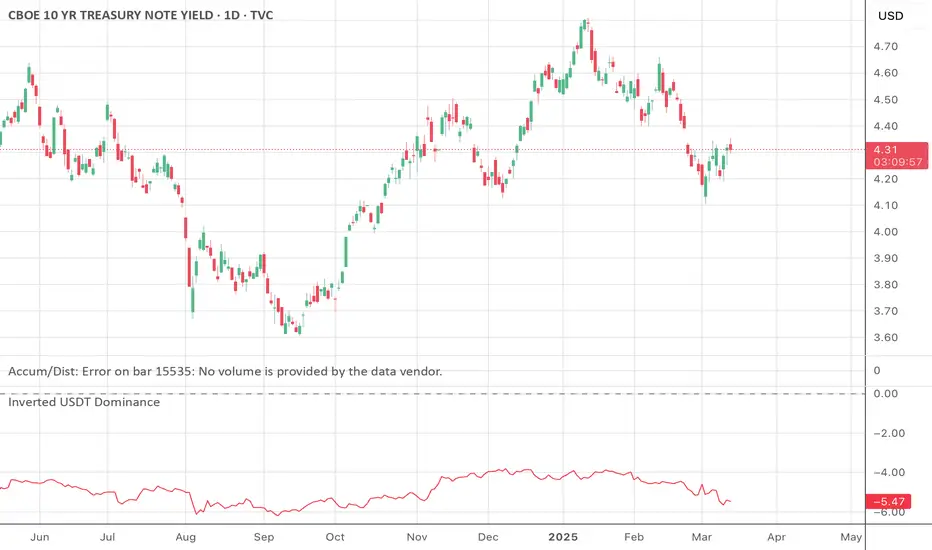
Inverted USDT Dominance

Inverted USDT Dominance Indicator
This simple yet powerful indicator plots the inverted USDT Dominance (USDT.D), making it visually intuitive to analyze market sentiment shifts. Typically, USDT dominance rises when investors seek stability, indicating a "risk-off" market environment. Conversely, it falls when investors pursue riskier assets like cryptocurrencies, signaling a "risk-on" environment.
Why invert the USDT Dominance chart?
By flipping USDT Dominance around the zero line, this indicator allows traders and investors to more clearly visualize its correlation and divergence with traditional market indicators like the 10-year Treasury yield (TNX), Bitcoin, or equity indices. A rising line on this inverted indicator intuitively indicates increasing market risk appetite, whereas a falling line highlights growing risk aversion.
Use cases:
Quickly visualize market sentiment (risk-on vs. risk-off).
Identify divergences and correlations between crypto markets and traditional financial instruments.
Enhance portfolio allocation decisions by clearly seeing sentiment changes.
نص برمجي مفتوح المصدر
بروح TradingView الحقيقية، قام مبتكر هذا النص البرمجي بجعله مفتوح المصدر، بحيث يمكن للمتداولين مراجعة وظائفه والتحقق منها. شكرا للمؤلف! بينما يمكنك استخدامه مجانًا، تذكر أن إعادة نشر الكود يخضع لقواعد الموقع الخاصة بنا.
إخلاء المسؤولية
لا يُقصد بالمعلومات والمنشورات أن تكون، أو تشكل، أي نصيحة مالية أو استثمارية أو تجارية أو أنواع أخرى من النصائح أو التوصيات المقدمة أو المعتمدة من TradingView. اقرأ المزيد في شروط الاستخدام.