This indicator estimates a volume footprint using tick data. The script automatically separates a candle into equidistant intervals with a width obtained from the average true range or a user-given width.
Settings
Style
Settings
- Method: Interval width calculation method. This ultimately determines the number of intervals separating one candle.
- Width (At the right of Method): Atr period or user given width depending on the selected method. A lower user-given width would divide a candle into a higher number of intervals.
- As Percent: Returns the accumulated volume within each interval as a percentage of the total candle volume.
Style
- Display Type: Determines the appearance of the returned volume footprint.
- Trend Color: Color to use based on whether a candle is bullish or bearish.
Usage
When applied to a chart, the user will be asked to select the settings to use for the volume footprint. Note that changing the settings afterward will reset the volume footprint, removing previously generated footprints.
A new footprint will appear on the confirmation of a new bar, as such this version might only be useful in lower timeframes.
A volume footprint allows users to see the number of contracts exchanged within a candle interval. It can as such be seen as some kind of intrabar volume profile.
This can be useful to see areas of interest within a candle.
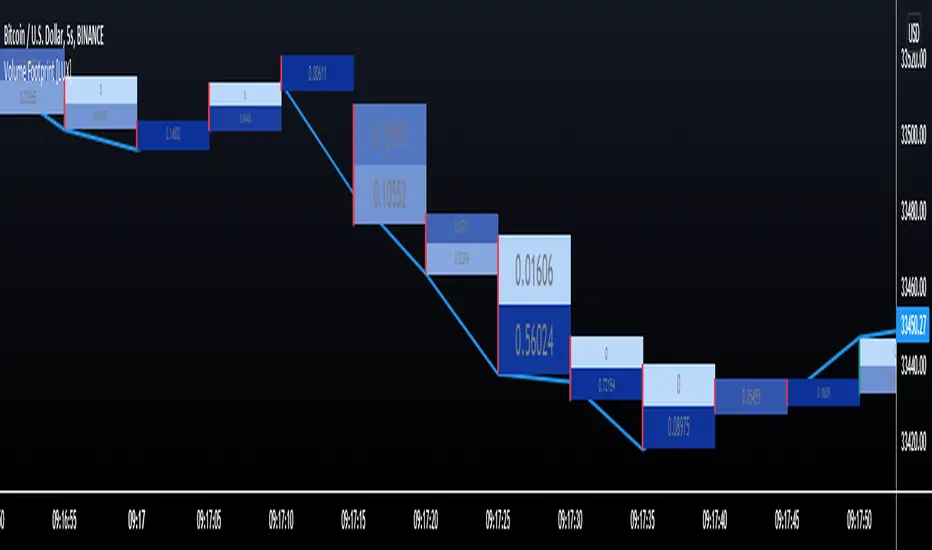
Different Appearance
By default, the volume footprint makes use of colored boxes with a color based on whether the candle was bullish or bearish.
Another appearance that gives additional information is the gradient type, which uses intervals color based on the number of contracts exchanged within an interval relative to the total volume of the candle. A higher number of contracts within an interval would return a darker color by default.
The regular display type makes use of boxes with a single color, with lines on the side indicating whether the candle was bullish or bearish.
ملاحظات الأخبار
Minor changes.نص برمجي مفتوح المصدر
بروح TradingView الحقيقية، قام مبتكر هذا النص البرمجي بجعله مفتوح المصدر، بحيث يمكن للمتداولين مراجعة وظائفه والتحقق منها. شكرا للمؤلف! بينما يمكنك استخدامه مجانًا، تذكر أن إعادة نشر الكود يخضع لقواعد الموقع الخاصة بنا.
Get exclusive indicators & AI trading strategies: luxalgo.com
Free 150k+ community: discord.gg/lux
All content provided by LuxAlgo is for informational & educational purposes only. Past performance does not guarantee future results.
Free 150k+ community: discord.gg/lux
All content provided by LuxAlgo is for informational & educational purposes only. Past performance does not guarantee future results.
إخلاء المسؤولية
لا يُقصد بالمعلومات والمنشورات أن تكون، أو تشكل، أي نصيحة مالية أو استثمارية أو تجارية أو أنواع أخرى من النصائح أو التوصيات المقدمة أو المعتمدة من TradingView. اقرأ المزيد في شروط الاستخدام.
نص برمجي مفتوح المصدر
بروح TradingView الحقيقية، قام مبتكر هذا النص البرمجي بجعله مفتوح المصدر، بحيث يمكن للمتداولين مراجعة وظائفه والتحقق منها. شكرا للمؤلف! بينما يمكنك استخدامه مجانًا، تذكر أن إعادة نشر الكود يخضع لقواعد الموقع الخاصة بنا.
Get exclusive indicators & AI trading strategies: luxalgo.com
Free 150k+ community: discord.gg/lux
All content provided by LuxAlgo is for informational & educational purposes only. Past performance does not guarantee future results.
Free 150k+ community: discord.gg/lux
All content provided by LuxAlgo is for informational & educational purposes only. Past performance does not guarantee future results.
إخلاء المسؤولية
لا يُقصد بالمعلومات والمنشورات أن تكون، أو تشكل، أي نصيحة مالية أو استثمارية أو تجارية أو أنواع أخرى من النصائح أو التوصيات المقدمة أو المعتمدة من TradingView. اقرأ المزيد في شروط الاستخدام.