OPEN-SOURCE SCRIPT
Top 40 constituents of S&P 500 Index
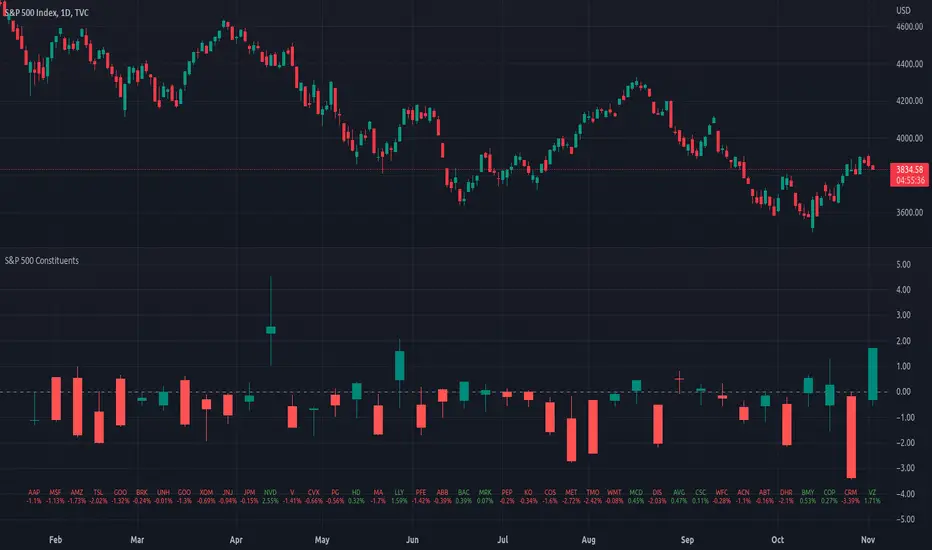
Displays real-time candles of top 40 constituents of S&P 500 Index ( SPX) for a given time frame, side-by-side. This gives an overall idea of breadth and depth of market movements in the time-frame.
Please note that, this is not a standard chart rendered bar-wise and may take time to load as it requests multiple securities. You could modify the contents, from settings, to include stocks from your portfolio or indices of different sectors.
Please note that, this is not a standard chart rendered bar-wise and may take time to load as it requests multiple securities. You could modify the contents, from settings, to include stocks from your portfolio or indices of different sectors.
نص برمجي مفتوح المصدر
بروح TradingView الحقيقية، قام مبتكر هذا النص البرمجي بجعله مفتوح المصدر، بحيث يمكن للمتداولين مراجعة وظائفه والتحقق منها. شكرا للمؤلف! بينما يمكنك استخدامه مجانًا، تذكر أن إعادة نشر الكود يخضع لقواعد الموقع الخاصة بنا.
إخلاء المسؤولية
لا يُقصد بالمعلومات والمنشورات أن تكون، أو تشكل، أي نصيحة مالية أو استثمارية أو تجارية أو أنواع أخرى من النصائح أو التوصيات المقدمة أو المعتمدة من TradingView. اقرأ المزيد في شروط الاستخدام.