OPEN-SOURCE SCRIPT
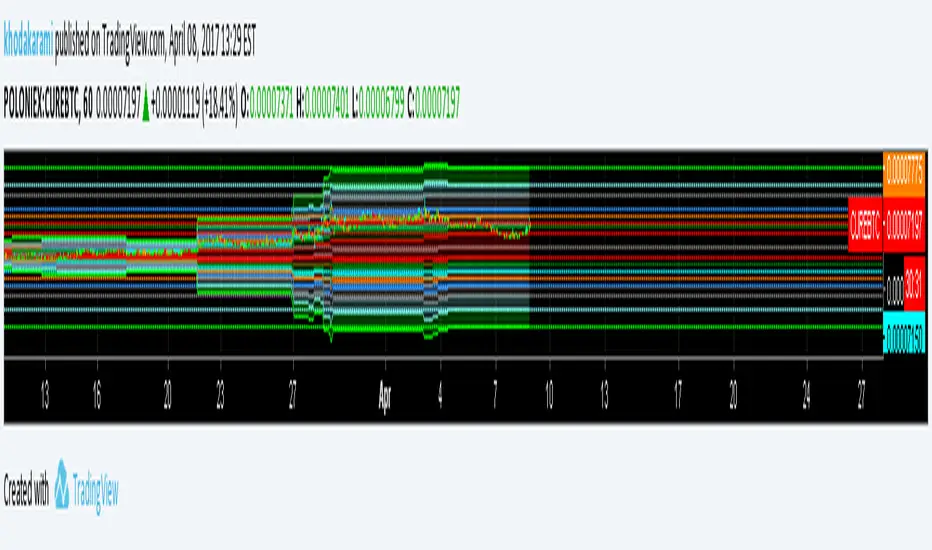
AutoFibLevels

Personally I don't like the trouble of drawing fibonacci retracement and extension tolls time and time again, not only human eyes and hands are not as accurate as a computer, but also, you would sit and think : "Hey, which one of these candles is the start of the wave" time and time again.
That is one of the issues, some times you may want to drop more than one fibo on the chart to see where they over lap and that, makes your chart hell to look into.
This script will draw fibonacci levels for you based on the time frame you are in, for each time frame the number of bars that it will look into differs and if you need to, you can adjust them per time frame separately.
And as always for indicators, you have total control on which lines to draw and clouds, and their color and transparency.
نص برمجي مفتوح المصدر
بروح TradingView الحقيقية، قام مبتكر هذا النص البرمجي بجعله مفتوح المصدر، بحيث يمكن للمتداولين مراجعة وظائفه والتحقق منها. شكرا للمؤلف! بينما يمكنك استخدامه مجانًا، تذكر أن إعادة نشر الكود يخضع لقواعد الموقع الخاصة بنا.
إخلاء المسؤولية
لا يُقصد بالمعلومات والمنشورات أن تكون، أو تشكل، أي نصيحة مالية أو استثمارية أو تجارية أو أنواع أخرى من النصائح أو التوصيات المقدمة أو المعتمدة من TradingView. اقرأ المزيد في شروط الاستخدام.