PROTECTED SOURCE SCRIPT
تم تحديثه Welivvinnlife & ocsabi03 OBV and GNL Hybrid Oscillator
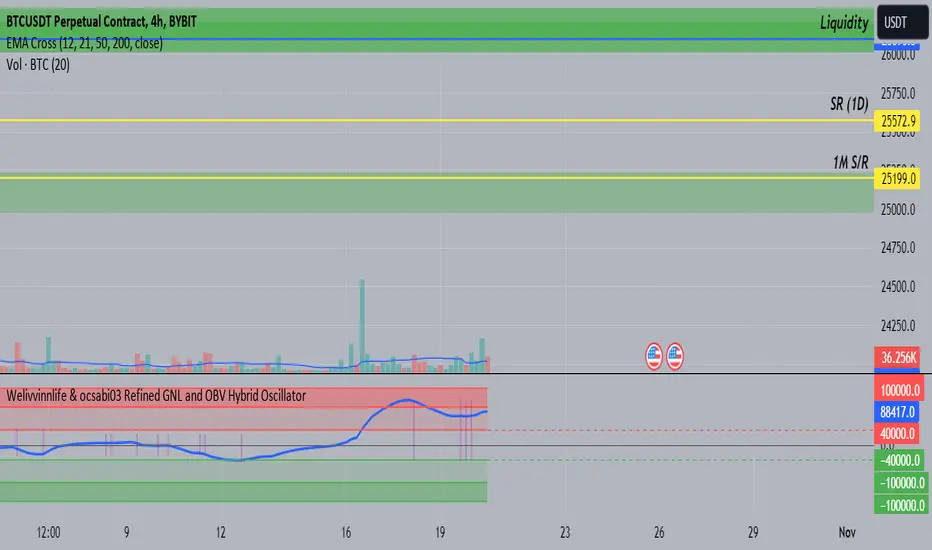
Signal Line (Blue): It gives a smoothed representation of the difference between OBV and GNL. When it moves upwards, it indicates that the recent differences between OBV and GNL are increasing, implying increased bullish momentum. When it moves downwards, it means that the differences are decreasing, suggesting increased bearish momentum.
The purple vertical lines are showing the inflection points of the blue line (if you want to see back in time use replay mode)
the green and red boxes ARE JUST VISUAL AIDS nothing else, not magic, those are the areas where a reversal can happen (not 100% of the time)
THIS IS NOT A MAGIC INDICATOR, ALWAYS USE THIS IN SOME KIND OF SYSTEM
ملاحظات الأخبار
-نص برمجي محمي
تم نشر هذا النص البرمجي كمصدر مغلق. ومع ذلك، يمكنك استخدامه بحرية ودون أي قيود - تعرف على المزيد هنا.
إخلاء المسؤولية
لا يُقصد بالمعلومات والمنشورات أن تكون، أو تشكل، أي نصيحة مالية أو استثمارية أو تجارية أو أنواع أخرى من النصائح أو التوصيات المقدمة أو المعتمدة من TradingView. اقرأ المزيد في شروط الاستخدام.
نص برمجي محمي
تم نشر هذا النص البرمجي كمصدر مغلق. ومع ذلك، يمكنك استخدامه بحرية ودون أي قيود - تعرف على المزيد هنا.
إخلاء المسؤولية
لا يُقصد بالمعلومات والمنشورات أن تكون، أو تشكل، أي نصيحة مالية أو استثمارية أو تجارية أو أنواع أخرى من النصائح أو التوصيات المقدمة أو المعتمدة من TradingView. اقرأ المزيد في شروط الاستخدام.