OPEN-SOURCE SCRIPT
Whale VWAP Heatmap

What it does
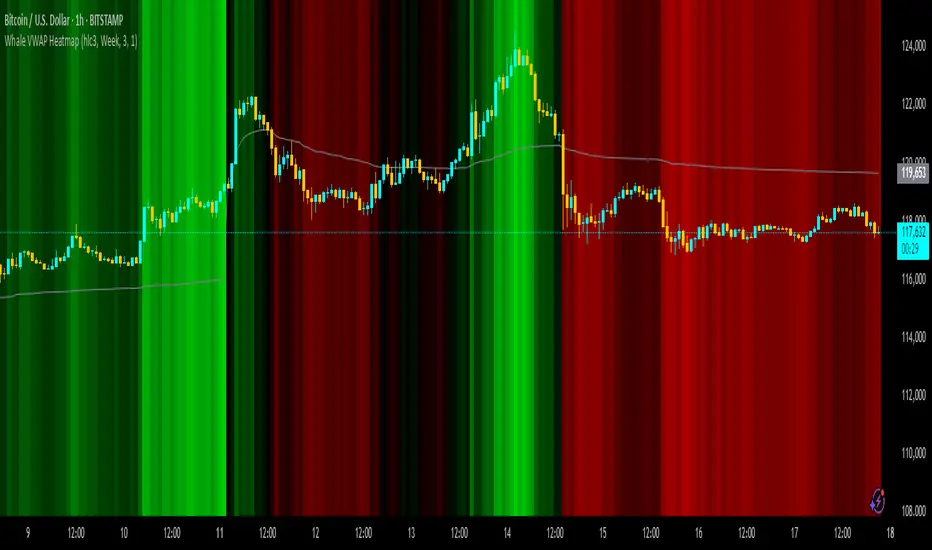
This indicator paints a heatmap around an anchored VWAP to make market context obvious at a glance.
Above VWAP → cyan background
Below VWAP → amber background
The farther price is from VWAP (in %), the stronger the color intensity.
How it works
Uses an anchored VWAP that resets on the period you choose (Session / Week / Month / Quarter / Year / Decade / Century / Earnings / Dividends / Splits).
Computes the percentage distance between price and VWAP, then maps that distance to background opacity.
Optional VWAP line can be shown/hidden.
Inputs (Settings)
Anchor Period — choose when VWAP resets (Session→Year, plus E/D/S options).
Source — price source (default hlc3).
Hide on D/W/M (Session only) — hides the script on Daily/Weekly/Monthly when anchor=Session (avoids NA behavior).
Enable Heatmap — turn background coloring on/off.
Max distance for full color (%) — at/above this % from VWAP, color hits full intensity (typical 0.5–2% depending on volatility).
Show VWAP Line / Line Color/Width — visual preference.
How to read it (quick playbook)
Context first: color tells you if price is trading above/below “fair value” (VWAP).
Intensity = how stretched price is from VWAP.
Use it to frame bias (above/below VWAP) and to avoid chasing extended moves.
Notes & limitations
Requires volume (VWAP is volume-weighted). If the data vendor doesn’t provide volume for the symbol, the script will stop.
For intraday, Session anchor is common. For swing/context, try Week or Month.
نص برمجي مفتوح المصدر
بروح TradingView الحقيقية، قام مبتكر هذا النص البرمجي بجعله مفتوح المصدر، بحيث يمكن للمتداولين مراجعة وظائفه والتحقق منها. شكرا للمؤلف! بينما يمكنك استخدامه مجانًا، تذكر أن إعادة نشر الكود يخضع لقواعد الموقع الخاصة بنا.
إخلاء المسؤولية
لا يُقصد بالمعلومات والمنشورات أن تكون، أو تشكل، أي نصيحة مالية أو استثمارية أو تجارية أو أنواع أخرى من النصائح أو التوصيات المقدمة أو المعتمدة من TradingView. اقرأ المزيد في شروط الاستخدام.