OPEN-SOURCE SCRIPT
Extension from 20 Period Simple Moving Average
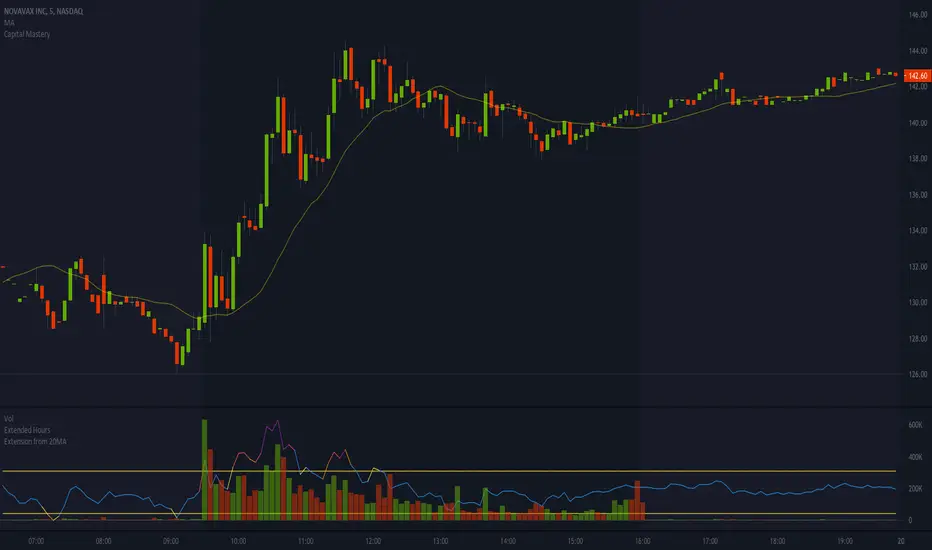
Simple indicator to help show when stocks are over extended intraday. It's based on the distance between a stock and it's moving average. The thesis being that, the farther away a stock is from it's 20 period simple moving average, the move extended it is. I've found that when a stock is more than 2-3% extended from it's 5min 20 period moving average, it's typically getting over extended, and can be a great time to start considering a short.
I primarily use this indicator when shorting intraday parabolic moves, while the stock is still on the frontside of the move. Note that this works best when the indicator is showing overextended AND there's a volume spike/mountain matching the overextension. In the attached example, you can see that I overlay this indicator on top of the volume panel because it helps me better visualize when the stock is getting over extended on heavy/elevated volume.
Hope this helps; any feedback is appreciated!
P.S. This works best on a 5min chart, but I'm sure it could be helpful on other timeframes, but may need to tweak the default outer bounds percentage.
نص برمجي مفتوح المصدر
بروح TradingView الحقيقية، قام مبتكر هذا النص البرمجي بجعله مفتوح المصدر، بحيث يمكن للمتداولين مراجعة وظائفه والتحقق منها. شكرا للمؤلف! بينما يمكنك استخدامه مجانًا، تذكر أن إعادة نشر الكود يخضع لقواعد الموقع الخاصة بنا.
إخلاء المسؤولية
لا يُقصد بالمعلومات والمنشورات أن تكون، أو تشكل، أي نصيحة مالية أو استثمارية أو تجارية أو أنواع أخرى من النصائح أو التوصيات المقدمة أو المعتمدة من TradingView. اقرأ المزيد في شروط الاستخدام.