PROTECTED SOURCE SCRIPT
Green Line Breakout (GLB)
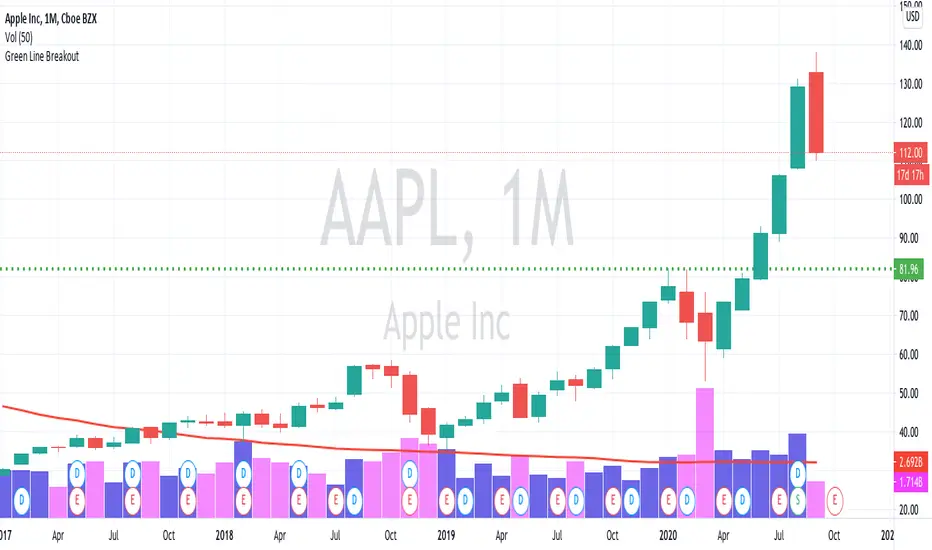
This is an implementation of Green Line Breakout (GLB) which is popularized by Eric Wish through his Wishing Wealth Blog.
GLB indicator looks at a monthly chart for a stock that hit a new all time high recently and draw a green horizontal line at the highest price reached at any month, that has not been surpassed for at least 3 months.
In other words, this method finds stock that reached an all-time high and has then rested for at least three months. When a stock moves through the green line or is above its last green line, it is an indication of strong buying interest.
Read more about how to use the indicator in Wishing Wealth Blog.
Usage Explanation:
1. Set the time frame to Monthly for a stock and automatically a green dashed line appears based on the calculation explained above
2. If no GLB found for a stock, then green line appears at 0.0
2. If you set any other time frame other than Monthly, no Green Dashed line shown
نص برمجي محمي
تم نشر هذا النص البرمجي كمصدر مغلق. ومع ذلك، يمكنك استخدامه بحرية ودون أي قيود - تعرف على المزيد هنا.
إخلاء المسؤولية
لا يُقصد بالمعلومات والمنشورات أن تكون، أو تشكل، أي نصيحة مالية أو استثمارية أو تجارية أو أنواع أخرى من النصائح أو التوصيات المقدمة أو المعتمدة من TradingView. اقرأ المزيد في شروط الاستخدام.