OPEN-SOURCE SCRIPT
SMA21+-Delta%
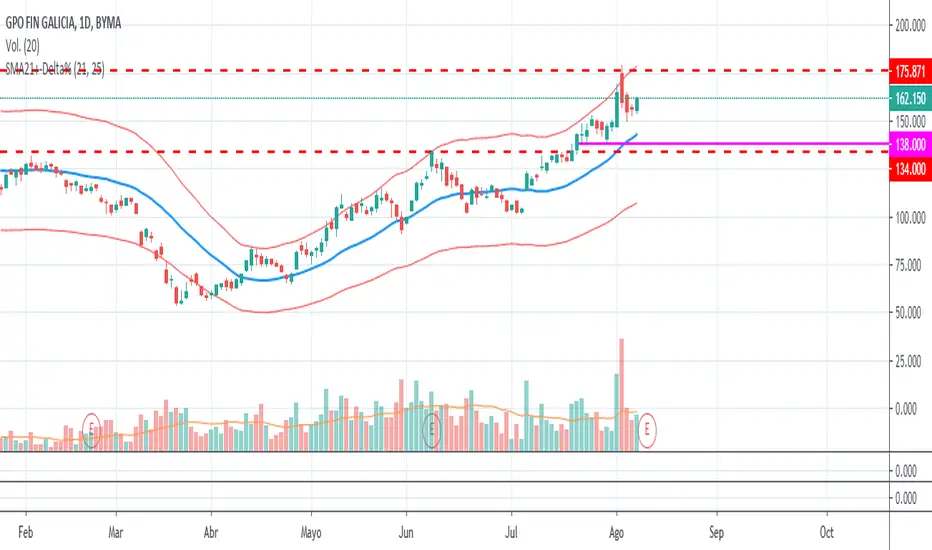
A simple script that plots a SMA of "length" periods, plus and minus "Delta %" of SMA value. Many Stocks shows a pattern off bulixh/bearish correction based on a % instead of any numbes of Standard Deviations, like Bollinger Bands do.
Default values:
length = 21
Delta% = 25
Un script simple que permite graficar una SMA de "length" períodos, +- "Delta%", un porcentage fijo respecto a la SMA. Muchos papeles muestran payrones de corrección basados en este tipo de límites, en lugar de una cierta cantidad de desvíos estándar, como es el caso de las Bandas de Bollinger.
نص برمجي مفتوح المصدر
بروح TradingView الحقيقية، قام مبتكر هذا النص البرمجي بجعله مفتوح المصدر، بحيث يمكن للمتداولين مراجعة وظائفه والتحقق منها. شكرا للمؤلف! بينما يمكنك استخدامه مجانًا، تذكر أن إعادة نشر الكود يخضع لقواعد الموقع الخاصة بنا.
إخلاء المسؤولية
لا يُقصد بالمعلومات والمنشورات أن تكون، أو تشكل، أي نصيحة مالية أو استثمارية أو تجارية أو أنواع أخرى من النصائح أو التوصيات المقدمة أو المعتمدة من TradingView. اقرأ المزيد في شروط الاستخدام.