PROTECTED SOURCE SCRIPT
تم تحديثه Daily Fractals
Custom Timeframe Candles - Fractal Analysis Tool
📊 Overview
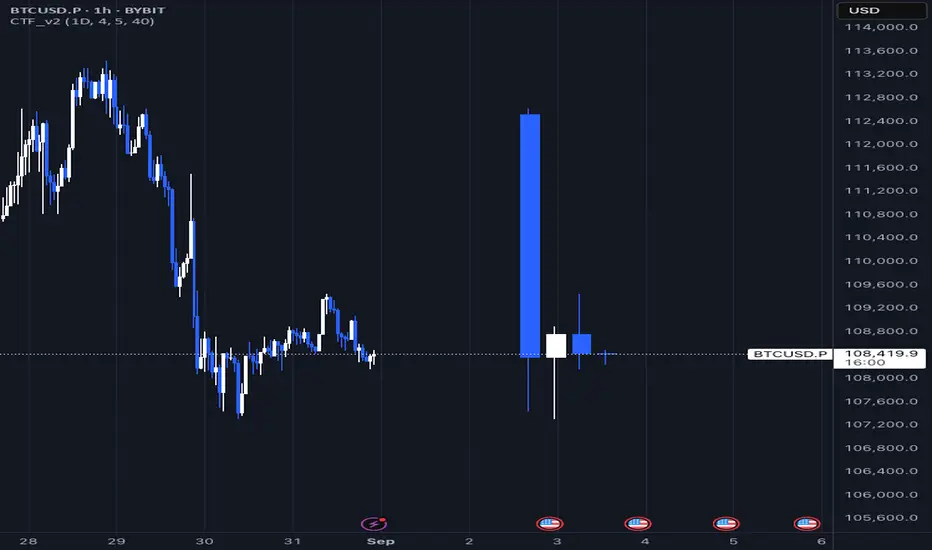
Custom Timeframe Candles is a powerful Pine Script indicator that displays higher timeframe (HTF) candles directly on your current chart, enabling seamless fractal analysis without switching between timeframes.
Perfect for traders who want to analyze daily candles while trading on hourly charts, or any other timeframe combination.
✨ Key Features
🎯 Multi-Timeframe Analysis
- Display any higher timeframe candles on your current chart
- Real-time updates of the current HTF candle as price moves
- Configurable number of candles (1-10) to display
🎮 How to Use
1. Add to Chart: Apply the indicator to any timeframe chart
2. Select HTF: Choose your desired higher timeframe (e.g., "1D" for daily)
3. Configure Display: Set number of candles, colors, and position
4. Analyze: View HTF context while trading on lower timeframes
📈 Perfect For Backtest
Unlike basic HTF displays, this indicator provides:
- Live Updates: Current candle updates in real-time
- Complete OHLC: Full candle structure with wicks
- Flexible Count: Display exactly what you need
- Stable Performance: No crashes during replay/backtesting
- Professional Design: Clean, customizable appearance
📝 Notes
- Works on all timeframes and instruments
- Requires higher timeframe data availability
- Compatible with replay mode and backtesting
---
by Rock9808
📊 Overview
Custom Timeframe Candles is a powerful Pine Script indicator that displays higher timeframe (HTF) candles directly on your current chart, enabling seamless fractal analysis without switching between timeframes.
Perfect for traders who want to analyze daily candles while trading on hourly charts, or any other timeframe combination.
✨ Key Features
🎯 Multi-Timeframe Analysis
- Display any higher timeframe candles on your current chart
- Real-time updates of the current HTF candle as price moves
- Configurable number of candles (1-10) to display
🎮 How to Use
1. Add to Chart: Apply the indicator to any timeframe chart
2. Select HTF: Choose your desired higher timeframe (e.g., "1D" for daily)
3. Configure Display: Set number of candles, colors, and position
4. Analyze: View HTF context while trading on lower timeframes
📈 Perfect For Backtest
Unlike basic HTF displays, this indicator provides:
- Live Updates: Current candle updates in real-time
- Complete OHLC: Full candle structure with wicks
- Flexible Count: Display exactly what you need
- Stable Performance: No crashes during replay/backtesting
- Professional Design: Clean, customizable appearance
📝 Notes
- Works on all timeframes and instruments
- Requires higher timeframe data availability
- Compatible with replay mode and backtesting
---
by Rock9808
ملاحظات الأخبار
remove debugملاحظات الأخبار
Remove debugging optionملاحظات الأخبار
Published somethingنص برمجي محمي
تم نشر هذا النص البرمجي كمصدر مغلق. ومع ذلك، يمكنك استخدامه بحرية ودون أي قيود - تعرف على المزيد هنا.
إخلاء المسؤولية
لا يُقصد بالمعلومات والمنشورات أن تكون، أو تشكل، أي نصيحة مالية أو استثمارية أو تجارية أو أنواع أخرى من النصائح أو التوصيات المقدمة أو المعتمدة من TradingView. اقرأ المزيد في شروط الاستخدام.
نص برمجي محمي
تم نشر هذا النص البرمجي كمصدر مغلق. ومع ذلك، يمكنك استخدامه بحرية ودون أي قيود - تعرف على المزيد هنا.
إخلاء المسؤولية
لا يُقصد بالمعلومات والمنشورات أن تكون، أو تشكل، أي نصيحة مالية أو استثمارية أو تجارية أو أنواع أخرى من النصائح أو التوصيات المقدمة أو المعتمدة من TradingView. اقرأ المزيد في شروط الاستخدام.