OPEN-SOURCE SCRIPT
تم تحديثه Relative Strength Comparator
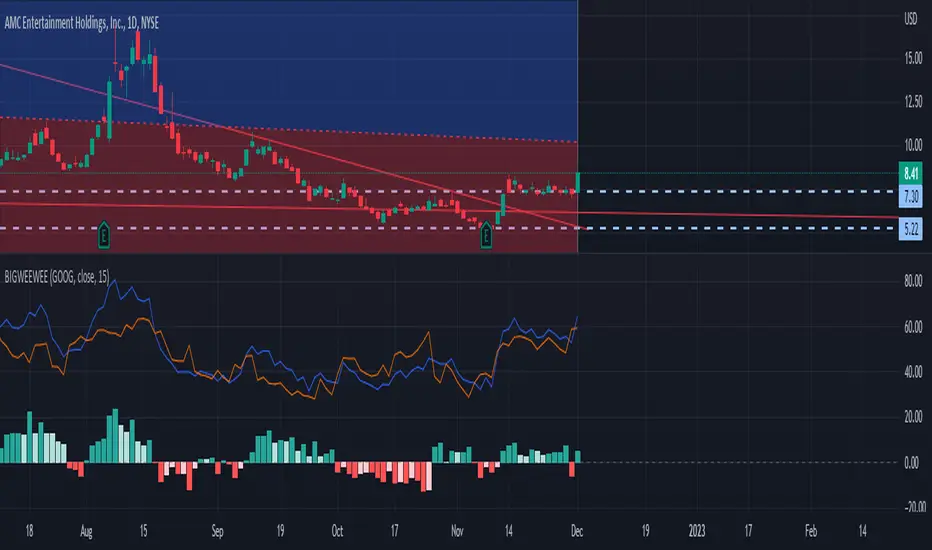
Basically just plots the RSI and the RSI of another stock you pick. Then subtracts the two and makes a histogram showing who's winning.
ملاحظات الأخبار
Fixed some of the names because yes I did copy paste from a MACD indicator.ملاحظات الأخبار
its the big weewee 2.0Yellow line is macd histogram of your stonk - the macd histogram of the stonk you select.
نص برمجي مفتوح المصدر
بروح TradingView الحقيقية، قام مبتكر هذا النص البرمجي بجعله مفتوح المصدر، بحيث يمكن للمتداولين مراجعة وظائفه والتحقق منها. شكرا للمؤلف! بينما يمكنك استخدامه مجانًا، تذكر أن إعادة نشر الكود يخضع لقواعد الموقع الخاصة بنا.
إخلاء المسؤولية
لا يُقصد بالمعلومات والمنشورات أن تكون، أو تشكل، أي نصيحة مالية أو استثمارية أو تجارية أو أنواع أخرى من النصائح أو التوصيات المقدمة أو المعتمدة من TradingView. اقرأ المزيد في شروط الاستخدام.