OPEN-SOURCE SCRIPT
تم تحديثه SAT - Sentiment Analysis Tool by Csth97
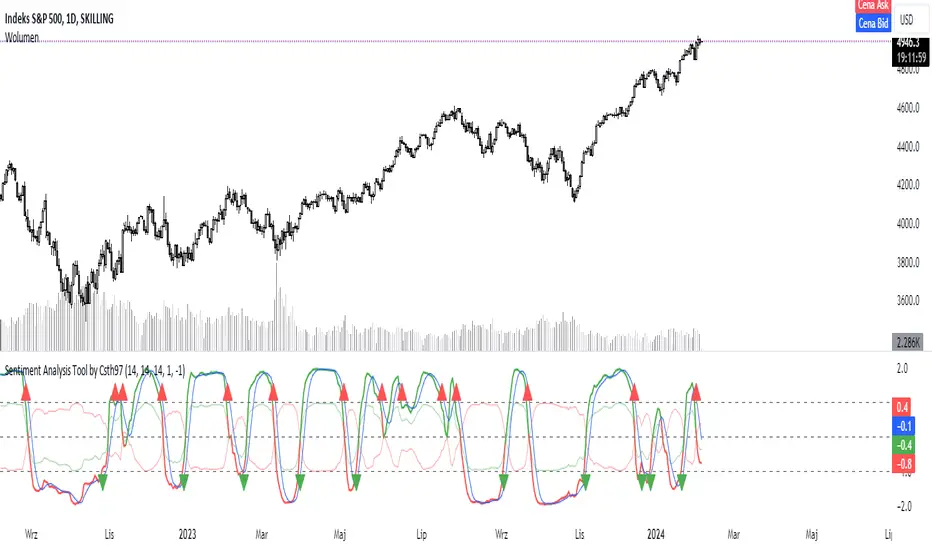
This code calculates the correlation between the ATR and the OBV of the price, and plots the difference between the positive and negative OBV correlations as a line. It also plots horizontal lines at the UP and DOWN levels, and signals bullish and bearish crosses when the difference line crosses those levels.
ملاحظات الأخبار
// This code calculates the correlation between the ATR and the OBV of the price, and plots the difference between the positive and negative OBV correlations as a line.//It also plots horizontal lines at the UP and DOWN levels, and signals bullish and bearish crosses when the difference line crosses those levels.
نص برمجي مفتوح المصدر
بروح TradingView الحقيقية، قام مبتكر هذا النص البرمجي بجعله مفتوح المصدر، بحيث يمكن للمتداولين مراجعة وظائفه والتحقق منها. شكرا للمؤلف! بينما يمكنك استخدامه مجانًا، تذكر أن إعادة نشر الكود يخضع لقواعد الموقع الخاصة بنا.
إخلاء المسؤولية
لا يُقصد بالمعلومات والمنشورات أن تكون، أو تشكل، أي نصيحة مالية أو استثمارية أو تجارية أو أنواع أخرى من النصائح أو التوصيات المقدمة أو المعتمدة من TradingView. اقرأ المزيد في شروط الاستخدام.