PROTECTED SOURCE SCRIPT
Smart Bullish Pennant Pattern

Description:
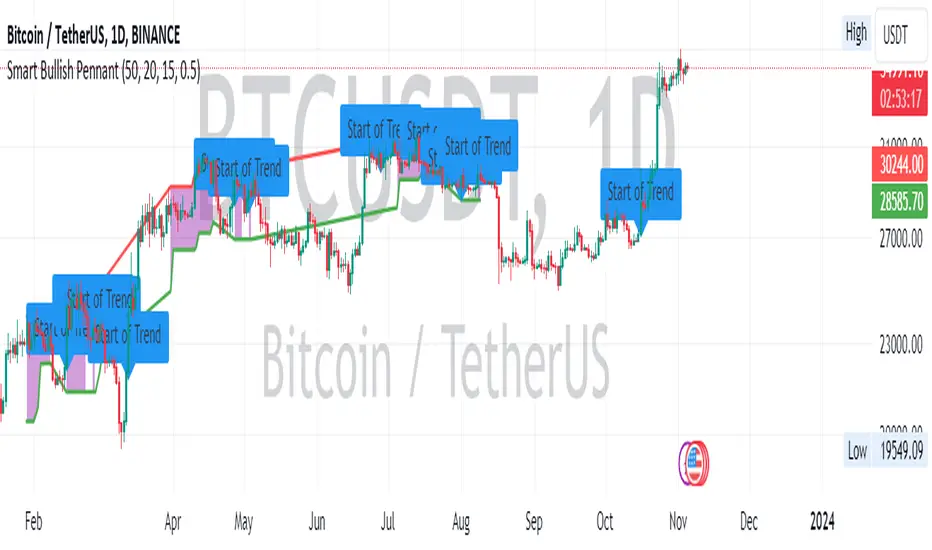
This script is designed to identify and visualize the Bullish Pennant pattern, a popular continuation pattern used by traders. The script follows a structured approach to identify the underlying bullish trend, the consolidation phase, and finally, the breakout from the pennant, which could signify a potential continuation of the bullish trend.
Here's how the script operates:
Bullish Trend Identification:
The script first identifies a bullish trend based on a user-defined length and a specified Exponential Moving Average (EMA).
A bullish trend is considered to be in place if the closing price is above the trend EMA, and the EMA is rising over the specified length of bars.
Consolidation Phase Detection:
During the bullish trend, the script looks for a consolidation phase, which is identified by comparing the range of the recent bars against the range of the bullish trend.
The consolidation phase is characterized by a narrowing price range, forming the pennant.
Breakout Confirmation:
A breakout from the consolidation is considered confirmed if the closing price breaks above the consolidation high, accompanied by an increase in volume.
The script allows for a one-bar delay in confirmation to avoid false breakout signals.
Price Target Calculation:
Upon a confirmed breakout, the script calculates the price target based on the height of the preceding bullish trend, added to the breakout point.
Visual Aids:
The script plots the consolidation range during the consolidation phase.
A breakout is visually indicated with a triangle above the breakout bar.
The price target is displayed on the chart with a step line.
Alerts:
An alert is triggered upon a confirmed breakout, notifying the trader of the potential bullish continuation.
Labels:
Labels are plotted to indicate the start of the bullish trend and the breakout point.
By employing this script, traders can automate the process of identifying the Bullish Pennant pattern, aiding in timely decision making for potential trade entries and exits.
This script is protected, ensuring its proprietary nature while sharing its utility with the TradingView community.
نص برمجي محمي
تم نشر هذا النص البرمجي كمصدر مغلق. ومع ذلك، يمكنك استخدامه بحرية ودون أي قيود - تعرف على المزيد هنا.
إخلاء المسؤولية
لا يُقصد بالمعلومات والمنشورات أن تكون، أو تشكل، أي نصيحة مالية أو استثمارية أو تجارية أو أنواع أخرى من النصائح أو التوصيات المقدمة أو المعتمدة من TradingView. اقرأ المزيد في شروط الاستخدام.