PROTECTED SOURCE SCRIPT
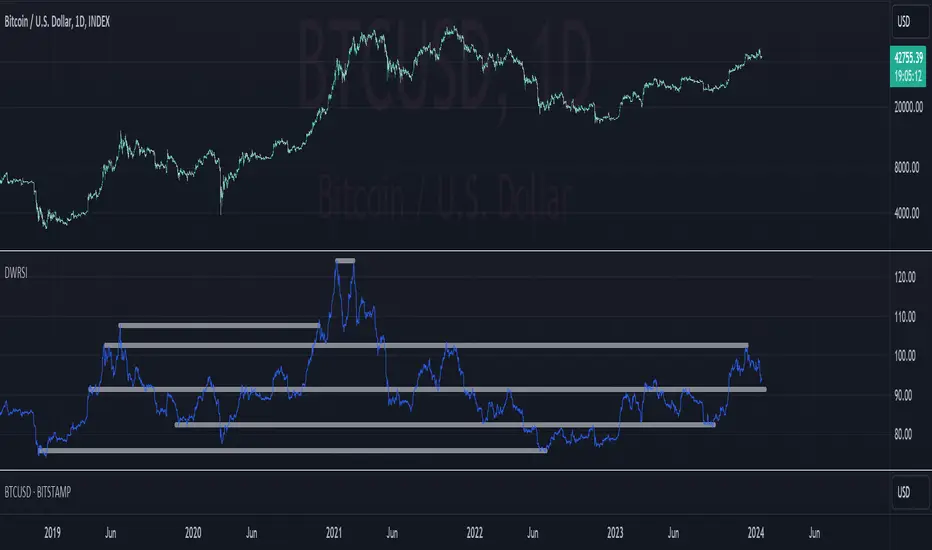
Dual Weighted RSI

Description:
The Dual Weighted RSI (DWRSI) is a custom technical analysis tool that extends the concept of the traditional Relative Strength Index (RSI) by incorporating two different RSI calculations, each with its own timeframe and weighting factor. This unique approach allows traders to analyze market momentum through a combination of RSIs from different timeframes, providing a more nuanced and customizable view of market conditions.
The DWRSI calculates two separate RSIs based on user-defined timeframes (e.g., daily, weekly) and applies a scale factor to each RSI, ranging from 0 to 1. This scale factor determines the contribution of each RSI to the final combined value: a factor of 1 means the full value of the RSI is used, 0 means none of the value is used, and 0.5 means half of the value is used. The final DWRSI value is the sum of these scaled RSIs, offering a unique perspective on market trends.
How to Use:
Add the Indicator: Search for "Dual Weighted RSI" or "DWRSI" in the TradingView indicators list and add it to your chart.
Set the Parameters:
First RSI Length: Set the period length for the first RSI calculation.
First RSI Timeframe: Choose the timeframe for the first RSI (e.g., "D" for daily).
First RSI Scale Factor: Adjust the scale factor for the first RSI (0 to 1).
Second RSI Length: Set the period length for the second RSI calculation.
Second RSI Timeframe: Choose the timeframe for the second RSI (e.g., "W" for weekly).
Second RSI Scale Factor: Adjust the scale factor for the second RSI (0 to 1).
Interpret the DWRSI:
A rising DWRSI indicates increasing bullish momentum, while a falling DWRSI suggests growing bearish momentum.
Compare the DWRSI with the individual RSI plots to assess the influence of different timeframes.
Trading Signals:
Potential buy signals are indicated when the DWRSI crosses above key levels (e.g., 30 or 50).
Potential sell signals are suggested when the DWRSI crosses below key levels (e.g., 70 or 50).
Use Cases:
DWRSI is ideal for traders who want to combine short-term and long-term momentum analysis.
It suits various trading styles, including swing trading, day trading, and positional trading.
نص برمجي محمي
تم نشر هذا النص البرمجي كمصدر مغلق. ومع ذلك، يمكنك استخدامه بحرية ودون أي قيود - تعرف على المزيد هنا.
إخلاء المسؤولية
لا يُقصد بالمعلومات والمنشورات أن تكون، أو تشكل، أي نصيحة مالية أو استثمارية أو تجارية أو أنواع أخرى من النصائح أو التوصيات المقدمة أو المعتمدة من TradingView. اقرأ المزيد في شروط الاستخدام.