OPEN-SOURCE SCRIPT
Pullback and Throwback Candle [TrendX_]
Pullback and Throwback candles can help traders determine the the potential reversal points
USAGE
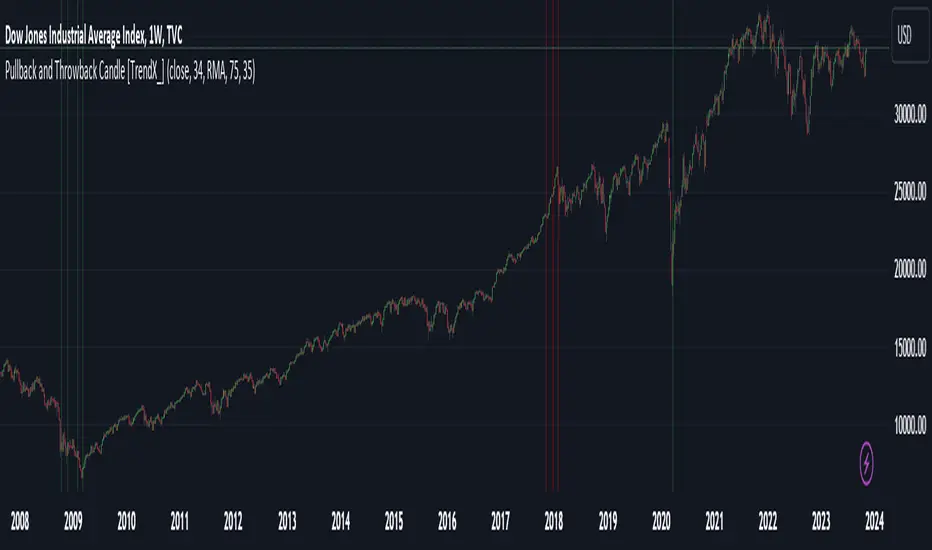
The indicator identifies pullback and throwback in overbought and oversold zones by measuring the distance between the price and its relative strength index.
A Pullback is an expected rebound in a downtrend (painted in green area), while a Throwback is a bounceback from an uptrend (painted in red area).
The strategy is useful for valuing reversal points. Accordingly, it can also be helpful for traders to use alongside other Technical Analysis indicators.
DISCLAIMER
This indicator is not financial advice, it can only help traders make better decisions.
There are many factors and uncertainties that can affect the outcome of any endeavor, and no one can guarantee or predict with certainty what will occur.
Therefore, one should always exercise caution and judgment when making decisions based on past performance.
USAGE
The indicator identifies pullback and throwback in overbought and oversold zones by measuring the distance between the price and its relative strength index.
A Pullback is an expected rebound in a downtrend (painted in green area), while a Throwback is a bounceback from an uptrend (painted in red area).
The strategy is useful for valuing reversal points. Accordingly, it can also be helpful for traders to use alongside other Technical Analysis indicators.
DISCLAIMER
This indicator is not financial advice, it can only help traders make better decisions.
There are many factors and uncertainties that can affect the outcome of any endeavor, and no one can guarantee or predict with certainty what will occur.
Therefore, one should always exercise caution and judgment when making decisions based on past performance.
نص برمجي مفتوح المصدر
بروح TradingView الحقيقية، قام مبتكر هذا النص البرمجي بجعله مفتوح المصدر، بحيث يمكن للمتداولين مراجعة وظائفه والتحقق منها. شكرا للمؤلف! بينما يمكنك استخدامه مجانًا، تذكر أن إعادة نشر الكود يخضع لقواعد الموقع الخاصة بنا.
إخلاء المسؤولية
لا يُقصد بالمعلومات والمنشورات أن تكون، أو تشكل، أي نصيحة مالية أو استثمارية أو تجارية أو أنواع أخرى من النصائح أو التوصيات المقدمة أو المعتمدة من TradingView. اقرأ المزيد في شروط الاستخدام.