OPEN-SOURCE SCRIPT
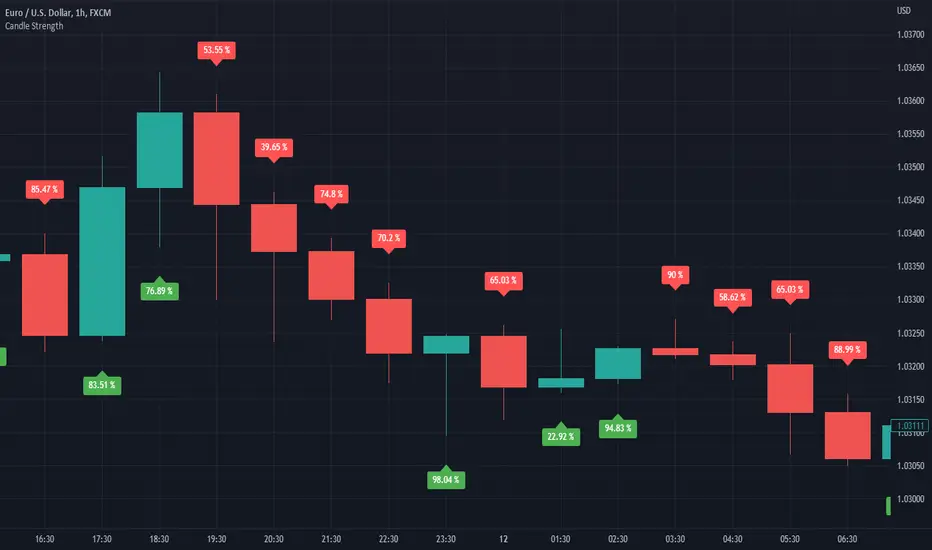
Candle Strength

It is hard to know which party plays a vital role in the candle. Sometimes we see a red candle/ Seller's candle very weak, but still, the market continues. Here, I tried to figure out how much strength buyers/sellers possess in their respective candles.
The idea is simply to measure the area between high and low and then calculate the opposite party's oppression by calculating the wick's area.
This script is more like a tool, and hence I do not suggest using this as an independent strategy. However, combining it with other analyses and strategies will surely bear fruitful results.
I, in the future, will come up with strategies and more tools like this.
So, follow me to keep getting updates.
Thanks.
نص برمجي مفتوح المصدر
بروح TradingView الحقيقية، قام مبتكر هذا النص البرمجي بجعله مفتوح المصدر، بحيث يمكن للمتداولين مراجعة وظائفه والتحقق منها. شكرا للمؤلف! بينما يمكنك استخدامه مجانًا، تذكر أن إعادة نشر الكود يخضع لقواعد الموقع الخاصة بنا.
إخلاء المسؤولية
لا يُقصد بالمعلومات والمنشورات أن تكون، أو تشكل، أي نصيحة مالية أو استثمارية أو تجارية أو أنواع أخرى من النصائح أو التوصيات المقدمة أو المعتمدة من TradingView. اقرأ المزيد في شروط الاستخدام.