PROTECTED SOURCE SCRIPT
تم تحديثه ETHBTC Z-Score
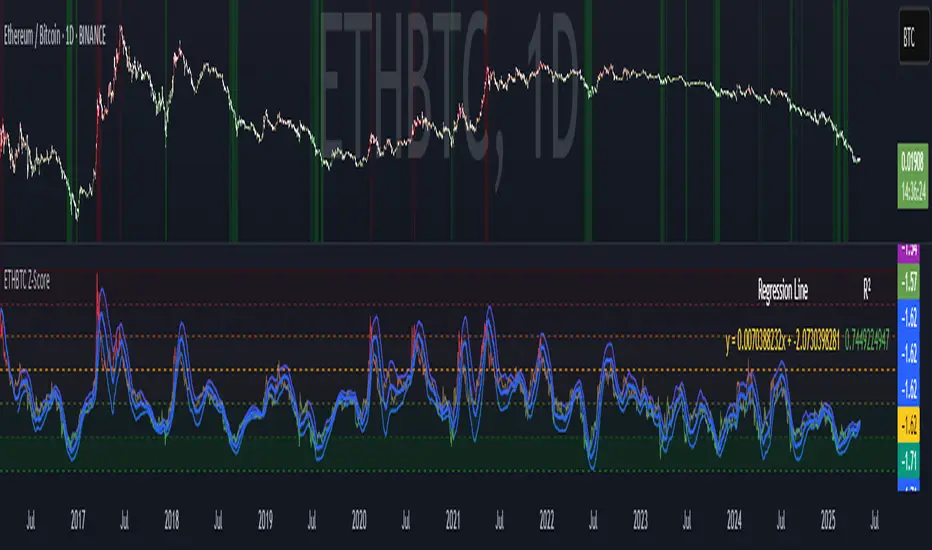
ETHBTC Z-Score Indicator
Key Features
Z-Score Calculation: Measures how far ETHBTC deviates from its mean over a user-defined period.
Linear Regression Line: Tracks the trend of the Z-score using least squares regression.
Standard Deviation Bands: Plots ±N standard deviations around the regression line to show expected Z-score range.
Dynamic Thresholds: Highlights overbought (e.g. Z > 1) and oversold (e.g. Z < -2) zones using color and background fill.
Visual & Table Display: Color-coded bars, horizontal level fills, and optional table showing regression formula and R².
Usage
Spot overbought/oversold extremes when Z-score crosses defined thresholds.
Use the regression line as a dynamic baseline and its bands as range boundaries.
Monitor R² to gauge how well the regression line fits the recent Z-score trend.
Example
Z > 1: ETHBTC may be overbought — potential caution or mean-reversion.
Z < -2: ETHBTC may be oversold — possible buying opportunity.
Z near regression line: Price is in line with recent trend.
ملاحظات الأخبار
Updated to work on chart's timeframeنص برمجي محمي
تم نشر هذا النص البرمجي كمصدر مغلق. ومع ذلك، يمكنك استخدامه بحرية ودون أي قيود - تعرف على المزيد هنا.
إخلاء المسؤولية
لا يُقصد بالمعلومات والمنشورات أن تكون، أو تشكل، أي نصيحة مالية أو استثمارية أو تجارية أو أنواع أخرى من النصائح أو التوصيات المقدمة أو المعتمدة من TradingView. اقرأ المزيد في شروط الاستخدام.
نص برمجي محمي
تم نشر هذا النص البرمجي كمصدر مغلق. ومع ذلك، يمكنك استخدامه بحرية ودون أي قيود - تعرف على المزيد هنا.
إخلاء المسؤولية
لا يُقصد بالمعلومات والمنشورات أن تكون، أو تشكل، أي نصيحة مالية أو استثمارية أو تجارية أو أنواع أخرى من النصائح أو التوصيات المقدمة أو المعتمدة من TradingView. اقرأ المزيد في شروط الاستخدام.