OPEN-SOURCE SCRIPT
chentz Volume MACD
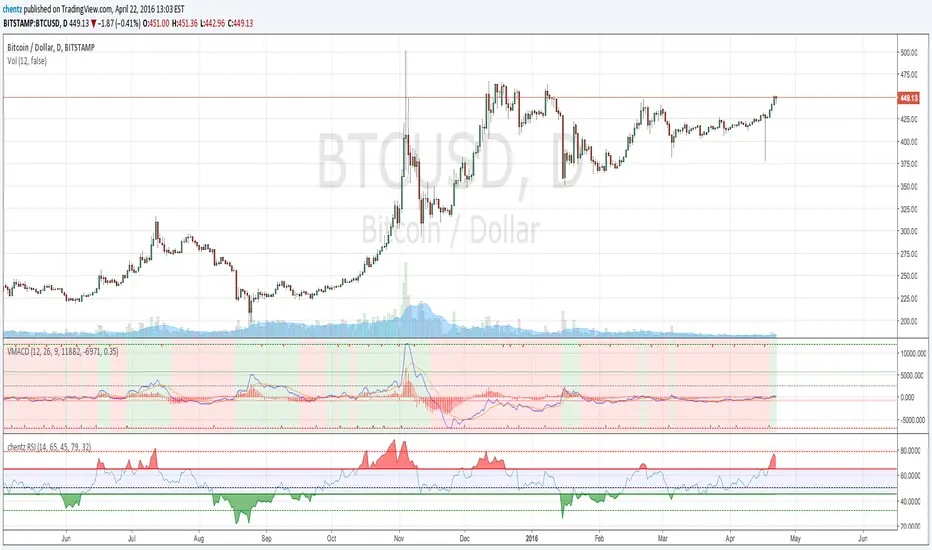
A MACD indicator over the volume to see pattern over the volume.
Adaptation of script from
and using the theoretical foundation from moneyshow.com/articles.asp?aid=daytraders-18013
Adaptation of script from
and using the theoretical foundation from moneyshow.com/articles.asp?aid=daytraders-18013
نص برمجي مفتوح المصدر
بروح TradingView الحقيقية، قام مبتكر هذا النص البرمجي بجعله مفتوح المصدر، بحيث يمكن للمتداولين مراجعة وظائفه والتحقق منها. شكرا للمؤلف! بينما يمكنك استخدامه مجانًا، تذكر أن إعادة نشر الكود يخضع لقواعد الموقع الخاصة بنا.
إخلاء المسؤولية
لا يُقصد بالمعلومات والمنشورات أن تكون، أو تشكل، أي نصيحة مالية أو استثمارية أو تجارية أو أنواع أخرى من النصائح أو التوصيات المقدمة أو المعتمدة من TradingView. اقرأ المزيد في شروط الاستخدام.