OPEN-SOURCE SCRIPT
Swing Highs and Lows (version 2)
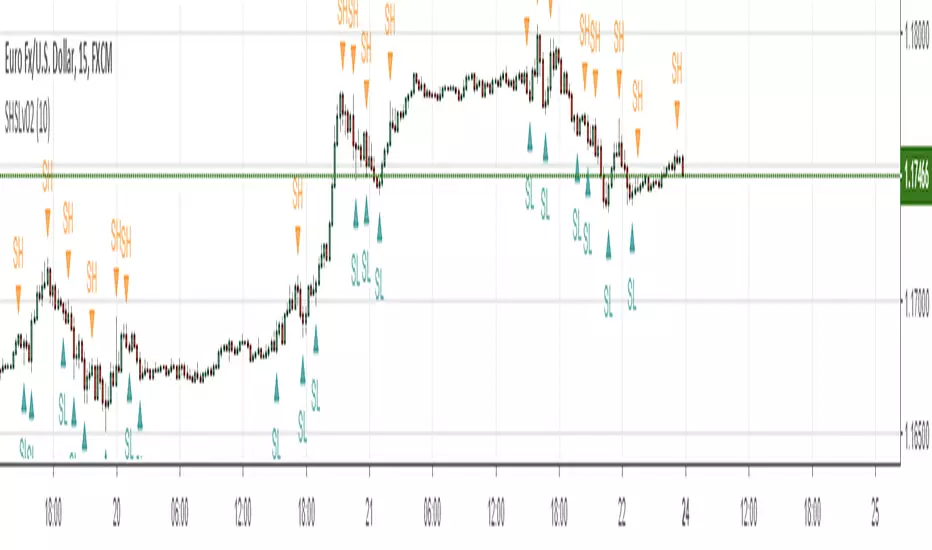
My second version of plotting Swing Highs and Swing Lows
A Swing High (SH): a price bar high preceed by two lower highs (LH) and followed by two lower highs (LH)
This version enables you to ignores swing highs and lows when the market volatility is small and not suitable for trading.
Thus it will depict fewer number of SH and SL markers, making the chart a bit cleaner and easier for us to read.
Volatility is measured simply by the amount of pips moved within five consecutive bars: the default is set at 10 pips, meaning that when you take five consecutive bars and the gap of the highest high and the lowest low is less than or equal to 10 pips, it will not depict SH or SL markers.
To use this function, check "set volatility threshold?" box under the Format icon and set a threshold in pips.
(I typically trade EURUSD so the pips input is customized for that)
نص برمجي مفتوح المصدر
بروح TradingView الحقيقية، قام مبتكر هذا النص البرمجي بجعله مفتوح المصدر، بحيث يمكن للمتداولين مراجعة وظائفه والتحقق منها. شكرا للمؤلف! بينما يمكنك استخدامه مجانًا، تذكر أن إعادة نشر الكود يخضع لقواعد الموقع الخاصة بنا.
إخلاء المسؤولية
لا يُقصد بالمعلومات والمنشورات أن تكون، أو تشكل، أي نصيحة مالية أو استثمارية أو تجارية أو أنواع أخرى من النصائح أو التوصيات المقدمة أو المعتمدة من TradingView. اقرأ المزيد في شروط الاستخدام.