PROTECTED SOURCE SCRIPT
[XIDEN] Reversal Scanner
Xiden's reversal scanner is based on SMA.
It gives you visual reversal zones and possible entries to enter a reversal trade.
We always try to keep the chart clean, so we didn't go back on visuals, just essentials.
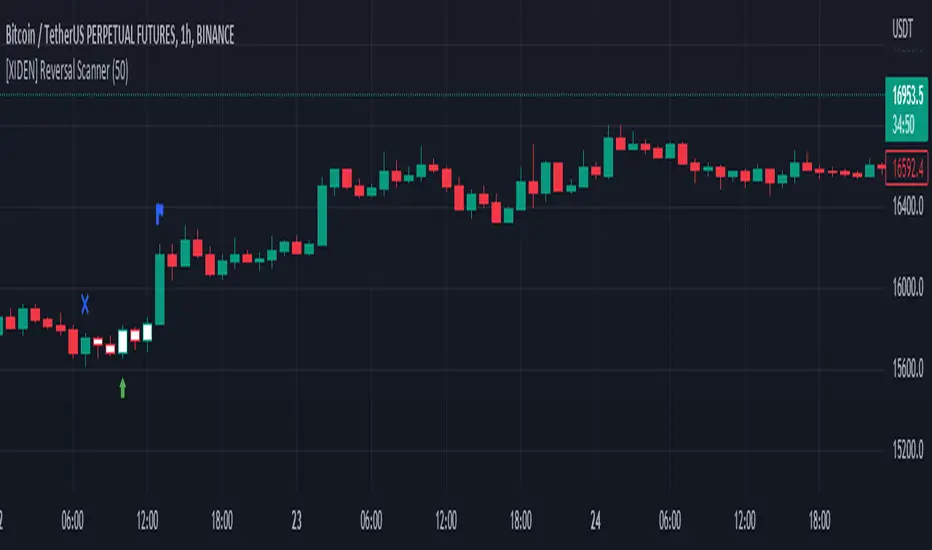
Here is a bullish example:

The blue cross indicates the start of a bullish reversal zone.
The blue flag indicates the end of the bullish reversal zone.
The green arrow marks a possible long entry.
Here is a bearish example:

Again:
The blue cross indicates the start of a bearish reversal zone.
The blue flag indicates the end of the bearish reversal zone.
The red arrow marks a possible short entry.
Don't use this tool as a standalone indicator to trade, always DYOR and use other factors to confirm a possible reversal.
It gives you visual reversal zones and possible entries to enter a reversal trade.
We always try to keep the chart clean, so we didn't go back on visuals, just essentials.
Here is a bullish example:
The blue cross indicates the start of a bullish reversal zone.
The blue flag indicates the end of the bullish reversal zone.
The green arrow marks a possible long entry.
Here is a bearish example:
Again:
The blue cross indicates the start of a bearish reversal zone.
The blue flag indicates the end of the bearish reversal zone.
The red arrow marks a possible short entry.
Don't use this tool as a standalone indicator to trade, always DYOR and use other factors to confirm a possible reversal.
نص برمجي محمي
تم نشر هذا النص البرمجي كمصدر مغلق. ومع ذلك، يمكنك استخدامه بحرية ودون أي قيود - تعرف على المزيد هنا.
إخلاء المسؤولية
لا يُقصد بالمعلومات والمنشورات أن تكون، أو تشكل، أي نصيحة مالية أو استثمارية أو تجارية أو أنواع أخرى من النصائح أو التوصيات المقدمة أو المعتمدة من TradingView. اقرأ المزيد في شروط الاستخدام.