OPEN-SOURCE SCRIPT
Don-x
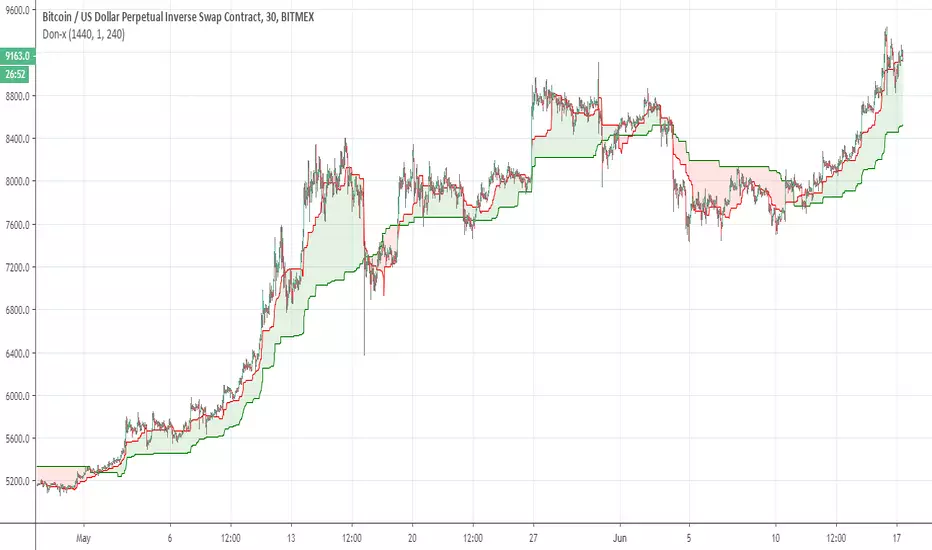
Simple indicator that nased on two donochian bases each calculated slight different with MTF , where we based a faster of 240 min over slower of daily one on each other and we put on lower time frame (30 min, 1 hour or 2 hour )
hence we can see the bullish trend (green ) or bearish trend (green ) more easy
can be used as by its own (slight lag ) or with other indicators to see where the asset direction is
hence we can see the bullish trend (green ) or bearish trend (green ) more easy
can be used as by its own (slight lag ) or with other indicators to see where the asset direction is
نص برمجي مفتوح المصدر
بروح TradingView الحقيقية، قام مبتكر هذا النص البرمجي بجعله مفتوح المصدر، بحيث يمكن للمتداولين مراجعة وظائفه والتحقق منها. شكرا للمؤلف! بينما يمكنك استخدامه مجانًا، تذكر أن إعادة نشر الكود يخضع لقواعد الموقع الخاصة بنا.
إخلاء المسؤولية
لا يُقصد بالمعلومات والمنشورات أن تكون، أو تشكل، أي نصيحة مالية أو استثمارية أو تجارية أو أنواع أخرى من النصائح أو التوصيات المقدمة أو المعتمدة من TradingView. اقرأ المزيد في شروط الاستخدام.