OPEN-SOURCE SCRIPT
تم تحديثه Sadosi Gap Selecter
This indicator is designed to be used on daily charts. Please note that it will not work with weekly or hourly data.
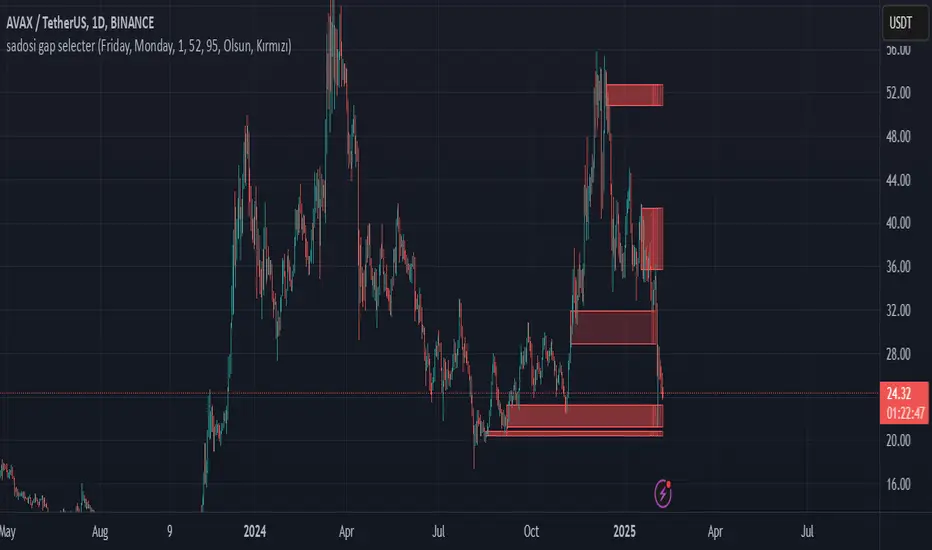
The Sadosi Gap Selecter is a powerful indicator designed to identify price gaps that occur between specific dates on the chart. It allows users to easily analyze price movements between selected weeks and days, highlighting these periods with visual boxes. This helps traders spot potential trend reversals and key price levels more effectively. It’s particularly valuable for those utilizing gap trading strategies to identify market inefficiencies.
The core functionality of this indicator is based on detecting price differences between two selected days within a defined date range. With the Start Day (day1) and End Day (day2) options, you can choose the exact days of the week you’d like to analyze. For instance, if you want to focus on price movements from Friday to Monday, simply select those days. Additionally, the Start Week (week1) and End Week (week2) settings allow you to narrow down the time frame on a weekly basis, making it easy to analyze price behavior during specific periods of the year.
For visual customization, several options are available. The Color (renk) setting lets you choose between red and yellow for the highlighted boxes. The Transparency (op) control adjusts the background opacity from 0% (fully opaque) to 100% (completely transparent), allowing you to manage how prominently the boxes appear on your chart. Furthermore, the Border (hat) option enables you to add or remove borders around the boxes, helping reduce visual clutter or emphasize certain areas depending on your preference.
Once applied to the chart, the indicator automatically generates boxes for the specified date ranges. The upper and lower bounds of each box are determined based on the price movement within that period, providing insights into the direction and strength of the trend. However, this tool does not generate definitive buy or sell signals on its own. It is recommended to use it alongside other technical analysis tools to make more informed trading decisions.
With the Sadosi Gap Selecter, you can gain clearer insights into price behavior, strengthen your trend analyses using historical data, and fully customize the settings to match your trading style for more effective results.
This indicator is designed to be used on daily charts. Please note that it will not work with weekly or hourly data
ملاحظات الأخبار
The Sadosi Gap Selecter is a powerful indicator designed to identify price gaps that occur between specific dates on the chart. It allows users to easily analyze price movements between selected weeks and days, highlighting these periods with visual boxes. This helps traders spot potential trend reversals and key price levels more effectively. It’s particularly valuable for those utilizing gap trading strategies to identify market inefficiencies.The core functionality of this indicator is based on detecting price differences between two selected days within a defined date range. With the Start Day (day1) and End Day (day2) options, you can choose the exact days of the week you’d like to analyze. For instance, if you want to focus on price movements from Friday to Monday, simply select those days. Additionally, the Start Week (week1) and End Week (week2) settings allow you to narrow down the time frame on a weekly basis, making it easy to analyze price behavior during specific periods of the year.
For visual customization, several options are available. The Color (renk) setting lets you choose between red and yellow for the highlighted boxes. The Transparency (op) control adjusts the background opacity from 0% (fully opaque) to 100% (completely transparent), allowing you to manage how prominently the boxes appear on your chart. Furthermore, the Border (hat) option enables you to add or remove borders around the boxes, helping reduce visual clutter or emphasize certain areas depending on your preference.
Once applied to the chart, the indicator automatically generates boxes for the specified date ranges. The upper and lower bounds of each box are determined based on the price movement within that period, providing insights into the direction and strength of the trend. However, this tool does not generate definitive buy or sell signals on its own. It is recommended to use it alongside other technical analysis tools to make more informed trading decisions.
With the Sadosi Gap Selecter, you can gain clearer insights into price behavior, strengthen your trend analyses using historical data, and fully customize the settings to match your trading style for more effective results.
Note: This indicator is designed to be used on daily charts. Please note that it will not work with weekly or hourly data.
نص برمجي مفتوح المصدر
بروح TradingView الحقيقية، قام مبتكر هذا النص البرمجي بجعله مفتوح المصدر، بحيث يمكن للمتداولين مراجعة وظائفه والتحقق منها. شكرا للمؤلف! بينما يمكنك استخدامه مجانًا، تذكر أن إعادة نشر الكود يخضع لقواعد الموقع الخاصة بنا.
إخلاء المسؤولية
The information and publications are not meant to be, and do not constitute, financial, investment, trading, or other types of advice or recommendations supplied or endorsed by TradingView. Read more in the Terms of Use.