OPEN-SOURCE SCRIPT
تم تحديثه Seri Indicator 0.1
This is a Moving Average based indicator that is inspired by the MACD indicator. The indicator is intended to indicate trend reversals, and works best in hourly charts (1h-2h-3h-4h).
The Seri Indicator is easy to interpret, which was one of the design goals. If the Fast Moving Average (Green Line) crosses ABOVE the Slow Moving Average (Red Line), it indicates a BULLISH Trend, therefore a BUY SIGNAL. If the Fast Moving Average (Green Line) crosses BELOW the Slow Moving Average (Red Line), it indicates a BEARISH trend, therefore a SELL SIGNAL. The indicator is in development phase so it is natural for it to give faulty signals, so it is good practice to use it on a longer-term chart than the intended one (Use 2h chart for hourly trades etc.).
Any suggestions for improvements are highly welcome!
ملاحظات الأخبار
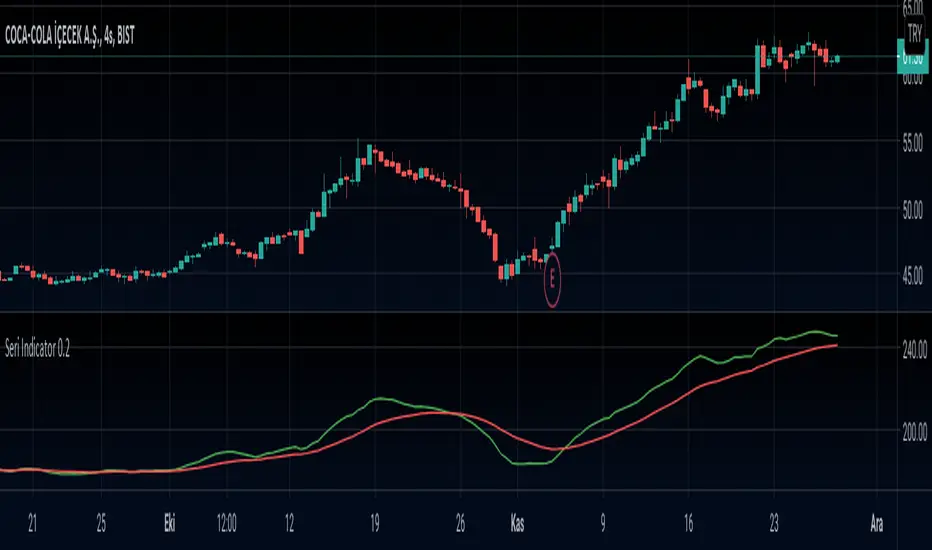
This is a Moving Average based indicator that is inspired by the MACD indicator. The indicator is intended to indicate trend reversals, and works best in hourly charts (1h-2h-3h-4h).The Seri Indicator is easy to interpret, which was one of the design goals. If the Fast Moving Average (Green Line) crosses ABOVE the Slow Moving Average (Red Line), it indicates a BULLISH Trend, therefore a BUY SIGNAL. If the Fast Moving Average (Green Line) crosses BELOW the Slow Moving Average (Red Line), it indicates a BEARISH trend, therefore a SELL SIGNAL. The indicator is in development phase so it is natural for it to give faulty signals, so it is good practice to use it on a longer-term chart than the intended one (Use 2h chart for hourly trades etc.).
The current version is 0.2. The indicator is still in alpha/testing phase therefore is not market-ready for big amounts of investment.
Any suggestions for improvements are highly welcome!
نص برمجي مفتوح المصدر
بروح TradingView الحقيقية، قام مبتكر هذا النص البرمجي بجعله مفتوح المصدر، بحيث يمكن للمتداولين مراجعة وظائفه والتحقق منها. شكرا للمؤلف! بينما يمكنك استخدامه مجانًا، تذكر أن إعادة نشر الكود يخضع لقواعد الموقع الخاصة بنا.
إخلاء المسؤولية
لا يُقصد بالمعلومات والمنشورات أن تكون، أو تشكل، أي نصيحة مالية أو استثمارية أو تجارية أو أنواع أخرى من النصائح أو التوصيات المقدمة أو المعتمدة من TradingView. اقرأ المزيد في شروط الاستخدام.