OPEN-SOURCE SCRIPT
تم تحديثه Squeeze Momentum with ADX Filter and Multi-Cycle Waves
Title:
Squeeze Momentum with ADX Filter and Multi-Cycle Waves
Description:
This indicator integrates three well-established technical analysis methodologies into a single oscillator to help traders assess volatility compression, trend strength, and cyclical momentum alignment:
Squeeze Momentum (TTM-style) – Based on Bollinger Bands and Keltner Channels, it identifies periods of low volatility ("the squeeze") followed by directional breakouts. The histogram reflects momentum using linear regression relative to a dynamic centerline. Positive values indicate upward momentum; negative values indicate downward momentum.
ADX with DI+/DI- (Welles Wilder, 1978) – The Average Directional Index is dynamically scaled to match the visual range of the Squeeze histogram. A user-defined Key Level (default: 32) serves as a reference threshold: when ADX rises above this level, it suggests a strong trend is present. DI+ (green) and DI- (red) show directional bias.
Multi-Cycle Waves (55/144/233) – Inspired by adaptive cycle analysis and MACD-style oscillators, these smoothed momentum waves help identify confluence across multiple timeframes. They are optional and appear as shaded areas when enabled.
Key Features:
The Squeeze Momentum Line appears as black/gray crosses at the zero level, indicating momentum polarity without visual clutter.
The Key Level is shown as a thick gray horizontal line, representing the ADX threshold in the scaled oscillator space.
ADX is plotted with increased line width (3) for better visibility.
All components are dynamically scaled to share the same vertical axis, enabling direct visual comparison.
Attribution:
Bollinger Bands: John Bollinger
Keltner Channels: Chester Keltner
Squeeze concept popularized by Linda Raschke and John Carter
ADX/DI system: J. Welles Wilder Jr.
Multi-cycle wave logic: inspired by John Ehlers’ work on market cycles
Integration, scaling logic, and visualization: © Carlos Mauricio Vizcarra (2025)
This script is published under the Mozilla Public License v2.0. It is open-source, non-promotional, and designed for educational and analytical use only. No investment advice is provided.
ملاحظات الأخبار
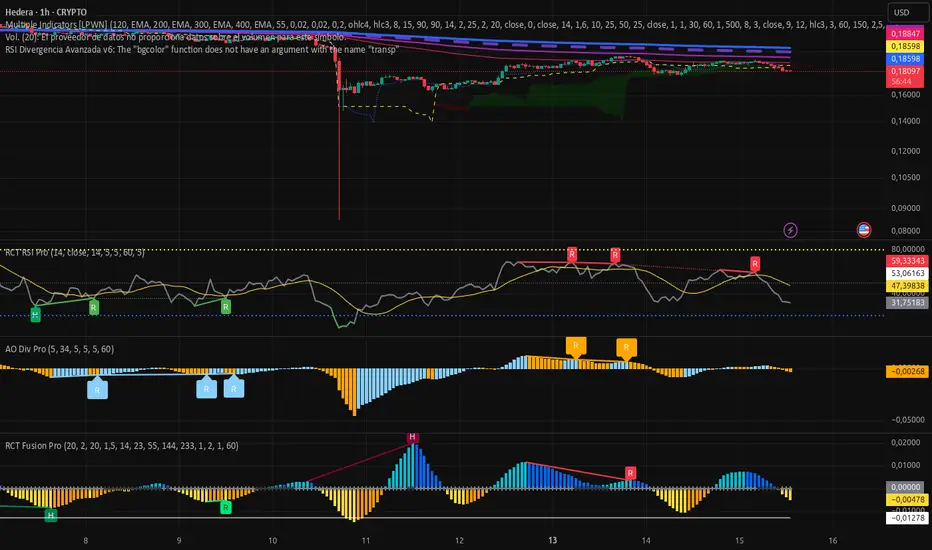
Official Description (English)RCT Fusion Pro – Squeeze, Momentum & Trend Convergence
This indicator integrates four proven market analysis concepts into a single, cohesive framework designed to identify high-probability trading opportunities through confluence:
Squeeze Momentum Oscillator (LazyBear version)
Detects periods of low volatility ("squeeze") using Bollinger Bands inside Keltner Channels. When the squeeze releases, the oscillator’s direction (positive/negative) and slope (increasing/decreasing) signal potential breakout momentum.
ADX with DI+ and DI−
Measures trend strength (ADX) and directional bias (DI+/DI−). A configurable key level (default: 23) helps filter trades—only strong trends are considered valid. All ADX-related plots are dynamically scaled to align with the squeeze oscillator for visual coherence.
Multi-Cycle TTM Waves (A/B/C)
Based on EMA-MACD structures with Fibonacci lengths (55, 144, 233), these waves act as momentum filters across short, medium, and long timeframes. Wave C (233) represents the dominant cycle and should align with trade direction.
Non-Repainting Divergence Detection
Automatically identifies regular and hidden bullish/bearish divergences on the squeeze oscillator. The logic uses pivot detection with configurable lookback ranges and avoids repainting by default (plots only on confirmed bars).
How It Works Together
A squeeze release (histogram turns bright) signals potential momentum.
ADX > key level confirms the market is trending (not ranging).
TTM Waves in alignment (e.g., all positive) validate multi-cycle strength.
Divergences provide early reversal or continuation signals during squeeze transitions.
How to Use
Long entry: Squeeze histogram turns aqua (↑ momentum), ADX > 23, DI+ > DI−, Wave C rising, and a bullish divergence appears.
Short entry: Histogram turns yellow/orange (↓ momentum), ADX > 23, DI− > DI+, Wave C falling, and a bearish divergence appears.
Avoid trades when ADX < 20 (weak trend) or TTM Waves conflict.
All visual elements are scaled to a single axis for clean interpretation. Built-in alerts support all divergence types.
This script is open-source under the Mozilla Public License 2.0. It builds upon public-domain concepts (Squeeze Momentum, ADX, TTM Waves) but adds original logic in scaling, confluence rules, and non-repainting divergence detection.
نص برمجي مفتوح المصدر
بروح TradingView الحقيقية، قام مبتكر هذا النص البرمجي بجعله مفتوح المصدر، بحيث يمكن للمتداولين مراجعة وظائفه والتحقق منها. شكرا للمؤلف! بينما يمكنك استخدامه مجانًا، تذكر أن إعادة نشر الكود يخضع لقواعد الموقع الخاصة بنا.
إخلاء المسؤولية
لا يُقصد بالمعلومات والمنشورات أن تكون، أو تشكل، أي نصيحة مالية أو استثمارية أو تجارية أو أنواع أخرى من النصائح أو التوصيات المقدمة أو المعتمدة من TradingView. اقرأ المزيد في شروط الاستخدام.