OPEN-SOURCE SCRIPT
Simplified Sizing
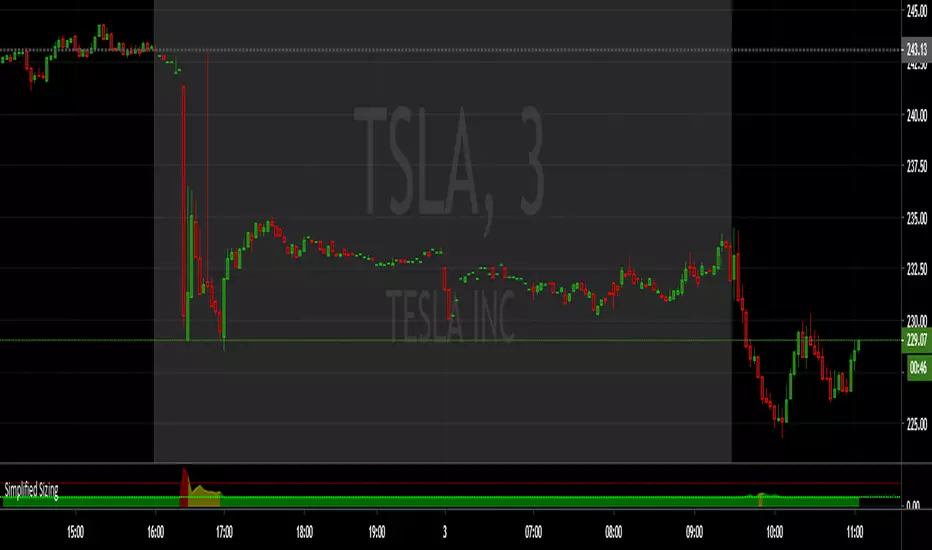
Ensure you Uncheck #1 , #2, #3 in the STYLE tab or it draws the lines you only need the numbers for.
The first number is the deviation from the EMA , anything below 1.75 == 1. (less than 0.75 % deviation)
NOTE: The fill area turns yellow @ 1.50 and red above 2.75
There are steps built in to slightly lower share size when specific levels of divergence register:
From 1.75 to 10 , 1 == 1.10 (10% reduction)
From 10 and up, 1 == 1.20 (20% reduction)
The second number is the Average True Range , calculated by the input length (RMA smoothed) and a multiplier (in decimal form).
NOTE: From 930-936 this value is multiplied by 1.5
The third number is the max share size.
The 4th number is the lot price if you take a position at the max size.
INPUTS:
ATR Length
EMA Length for divergence calculation
ATR Multiplier (0.1 - 10)
Equity in account
Max loss per trade.
Good Luck!
نص برمجي مفتوح المصدر
بروح TradingView الحقيقية، قام مبتكر هذا النص البرمجي بجعله مفتوح المصدر، بحيث يمكن للمتداولين مراجعة وظائفه والتحقق منها. شكرا للمؤلف! بينما يمكنك استخدامه مجانًا، تذكر أن إعادة نشر الكود يخضع لقواعد الموقع الخاصة بنا.
إخلاء المسؤولية
لا يُقصد بالمعلومات والمنشورات أن تكون، أو تشكل، أي نصيحة مالية أو استثمارية أو تجارية أو أنواع أخرى من النصائح أو التوصيات المقدمة أو المعتمدة من TradingView. اقرأ المزيد في شروط الاستخدام.